
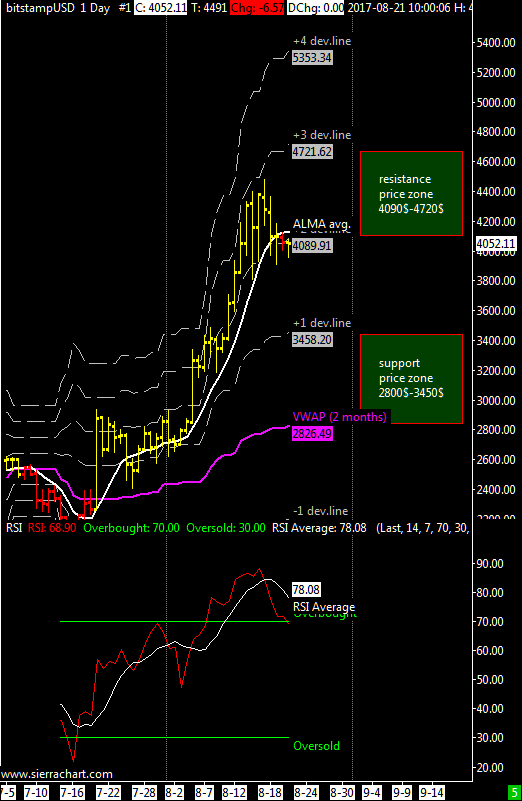
XBT / USD weekly price range is 3450$-4700$ | In the previous update, I was expecting an increase to 4800$ but the market retraced back to the second VWAP deviation line, I still think there is the will to move up but as maximum resistance for this week there is the third deviation line at 4700$.
The correction that has been seen from 4400$ to 4000$ is not uncommon in a bullish trend but further weakness could bring price down to the first deviation line at around 3400$ which I consider a good entry point where to buy.
As I explained in the past in a very strong market the RSI tends to approach the threshold of 70 without crossing below it, here we are in a similar situation with the RSI average moving towards 70 and the RSI itself already just above 70.
To conclude this week is somewhat important to see if there is still the possibility to do a new ATH or not in the short term.
In case of extreme fall, the support area is 2000$-2600$.
Follow me also on Twitter where I started to publish charts on both bitcoin and some of the most important altcoins using the TradingView.com platform
ITA version here

Enky what do you think about hashrate moving from BTC to BCH?
Soure:http://fork.lol/pow/hashrate