
Kama moving average is a very interesting filtering technique developed by P.Kaufman.
This moving average has been designed to account for market noise or volatility, KAMA will closely follow prices when swings are small and the noise is low, instead when the price swings widen KAMA will adjust trying to follow prices from a greater distance. This trend-following indicator can be used to identify the overall trend, time turning points and filter price movements when the market is flat avoiding annoying whipsaw false signals trades.
At the moment i’m working on a modified version of this indicator with the help of the tradingview online platform, i added deviation lines from the KAMA average and settings have been optimized to better track XBTUSD price movements on daily and weekly chart.
Here’s an example of this indicator applied to a weekly chart of XBTUSD with some comments.
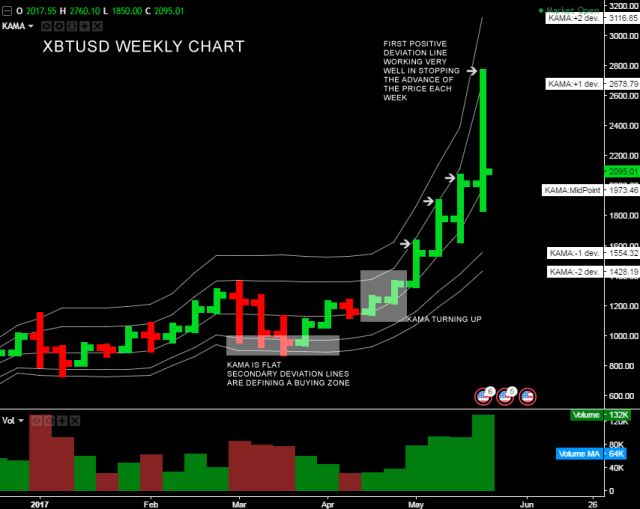
It’s evident that when the market is flat the KAMA average is relatively stable without giving false signals, when this happens you can try to trade deviation lines to catch bottoms or tops.
About this week the secondary positive deviation line is around 3200$, should you go short at that level? Well is at your own risk to trade against the main tendency that now is bullish, instead you might follow the trend buying at the midline or below it, i’m enough sure that today sell-off is healthy and the price was just moving back to the midline point (KAMA average) from the first positive deviation line.
Beware that because of very large price variation during the same bar the KAMA and its deviation lines can change a bit. The indicator is available for free at tradingview.com, just look for “KAMA – Enky v1.0”.
Your feedback is highly appreciated and will help me improving this trading tool.

What settings are you using for weekly KAMA? 10, 30, 2?
Thanks in advance!
Enky,
Thank you for this! I’m an avid user of TradingView. As I use mostly Gann squares, and other esoteric geometry/drawing tools, oscillators/indicators are of little use to me. However, I’ve always been fascinated by the way the 2-month VWAP that you highlight in your analysis (and its Std.Dev lines) correlate well with turning points in BTC. I have looked at TV for a good implementation of VWAP/StdDev but it doesn’t exist, so I appreciate you making this. I intend to test it rigorously.
On the subject of TV, here’s a chart from a guy I follow regularly, which accurately called the top, more or less, using Elliott Wave theory: https://www.tradingview.com/chart/BTCUSD/Wz28Nsic-BITSTAMP-Daily/
Indeed. I have very little use for Elliott Wave myself. I’ve found wave structure to be an undeniable part of markets, yet difficult to use EW to make predictions. As you say, you can’t get married to a position, or think “I know what the market will do next”. I mentioned the URL because I’m always fascinated by the concordance of multiple methods of analysis. Your VWAP, the other guy’s EW chart, my 2-week Gann fans showing significant resistance above $2600, etc. When dealing with significant market turns, multiple methods of analysis often agree with each other. Thanks again; happy trading!
Oh I forgot to mention, I am VERY much looking forward to studying Hurst. Ever since I read the basic postulates of his cycle theory, namely that cycles must phase-align in a trough for broad markets to make a bottom, my interest is very much piqued.
Thanks for making the indicator available for free! 🙂
Thank You mate.
God bless You.
Thanks again for the indicator. My only criticism is that you’ve locked the source code so that it can’t be modified. I had to add third and fourth deviations to accurately capture the moves in ETHUSD, which required copying your source code into a new Pine editor window due to the lock on the source code. That being said, your indicator seems to catch the dips in a variety of cryptos with great accuracy on the weekly timeframe. I’m most taken back by the dip in XRPUSDT (USD tether at Poloniex). Although the interest in XRP has been very limited until a couple of months ago, for the week beginning 5/22/17 your indicator had the baseline at 0.1285 and the correction was backstopped at a perfect 0.12. Anyone who bought the dip has doubled their money in about a week. Nicely done! A couple of other questions/comments:
1. Perhaps in a future blog post you could elaborate on your disdain for ETH (mine is because the hard fork/DAO incident looked really stupid). Despite my feelings, ETH’s smart contracts are quite revolutionary, and despite potential scaling problems, it seems to solve more problems than it creates. So I’d love to hear your thoughts.
2. You are well-rounded in your knowledge of trading and technical analysis. I wonder if you’ve ever studied any of John Ehlers work? Ehlers was an engineer for a US defense contractor, and applied many aspects of Digital Signal Processing, to existing oscillators and new ones he created. You reminded me of him with your description of KAMA, the way it attempts to eliminate latency, which is one of Ehlers’ key themes.
I will look into FRAMA, thanks for the reply.