
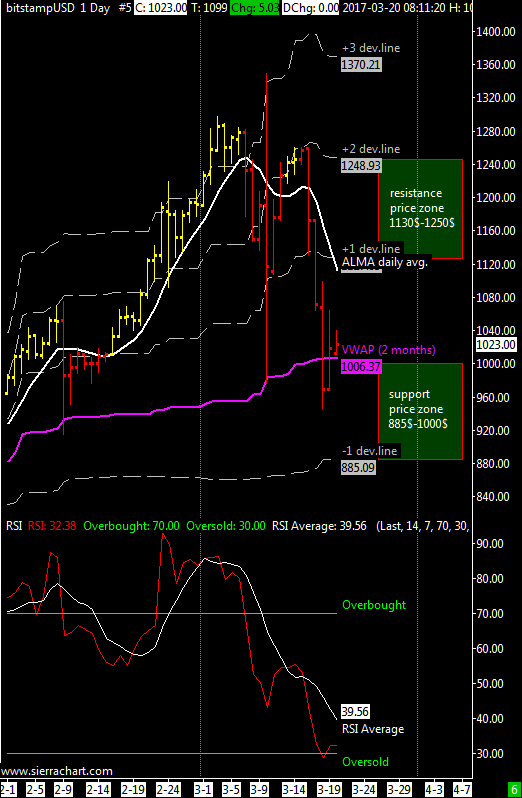
XBT / USD weekly price range is 885$-1130$ | The range of this week gives a support area at 880$ and resistsance from 1130$.
In the previous weekly update I said that a close of the weekly bar above 1030$ would have averted the risk of a weekly correction, the market has made a short test above this level and then quickly retreated, so I think that the chances to make a new low are high Determining a candidate level for a bottom isn’t complicated with my long term price regression channel on the weekly chart, this level is 830$ as I showed in my previous long-term update.
The ALMA average has obviously turned negative and the RSI oscillator is almost into oversold territory.
In cases of extreme fall the support area is 650-825 US dollars.

Pingback: Weekly Range Update – Better BTC