
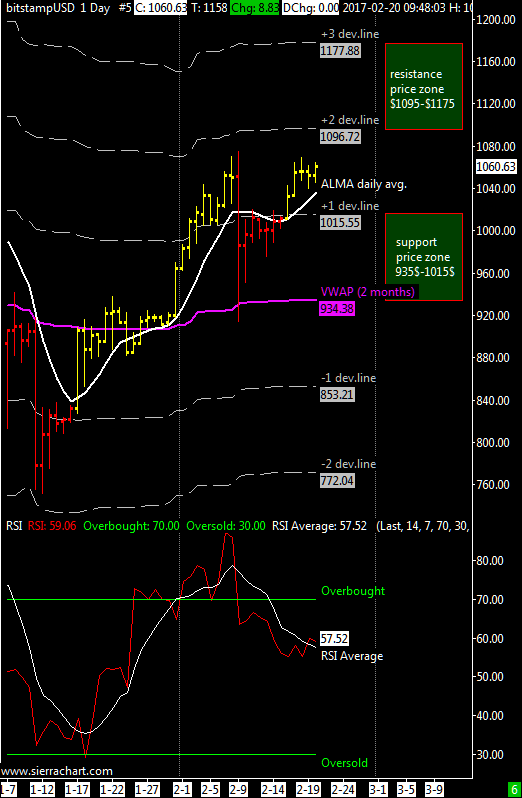
XBT / USD weekly price range is 935$-1095$ |Last week the cross XBTUSD has been stronger than expected so for this week the resistance is raised to 1100$, the support remains the VWAP at 935$.
The ALMA average has turned upward with the break of the resistance at 1015$ while the oscillator RSI has given a sell signal last week that has been ignored by the market confirming the strength of the bitcoin-dollar cross. The RSI has however pulled away from the overbought zone but remained above the mid-point of 50, thus remaining in bullish territory.
In short, the market is strong and has ignored my bearish worries of seven days ago; regarding my long-term position opened since 2014 I’ll continue to maintain it until I see some serious bearish indications on the weekly and monthly chart. I remind everyone that the average carrying price of my position is around 570$ (three units opened at 681$ , 615$ and 417$ ).
In cases of extreme fall the support area is updated to 650-760 US dollars.

Thanks a lot for the update.
This is a bit off-topic, but do you trade any alt-coins ?
Thank you for the update Enky.
Do you expect a retracement now at 1177, the +3 dev.line in your chart, now we passed the 1095-1100?
Or are we going parabolic and is the weekly chart in play here? If so, where is the next resistance in your weekly chart?
There are simply no sellers 🙂
I appreciate your weekly updates. Thank you for your contribution and effort and sharing your knowledge.
Indeed, a big thank you to Enky for sharing his analysis and most of all, it seems to me he’s among a very small number of honest people out here.
Just take a look at reddit, the level of manipulation and confusion is at ATH every day 😉