
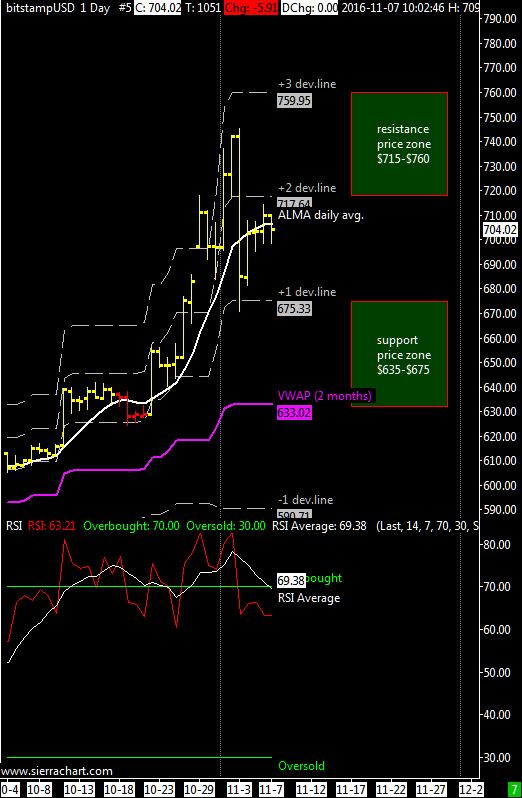
XBT / USD weekly price range is $ 675-$760 | daily ALMA moving average is firmly upward since 26 September, the main resistance is always the third positive price deviation line above the VWAP at $760, i consider the first positive price deviation line as support for this week at$ 675, our VWAP average is at $ 635.
The strong rise of the last four weeks is the consequence of the weekly cycle turned up in August. Now it remains to be seen if the market will be able to break through the $ 750 resistance with a move to the maximum target illustrated in my previouos update (the 870$-900$ price zone), it’s obvious that if XBTUSD goes under $ 675 with a possible minimum at the VWAP (~635 usd) then I believe that the Top at around 750$ is confirmed and we will see a correction in the weekly chart down to a new low, a low that will be probably above 450$ because the long term trend is still up.
The average daily RSI oscillator is in overbought zone and I think we can still ignore the information of this oscillator because the dominant timeframe is now the weekly one. The RSI on the weekly chart is not yet overbought but close to the 70 threshold.
In the event of a sharp fall the support is in the area $ 450-460.
Italian version here at bitchanger.com
