
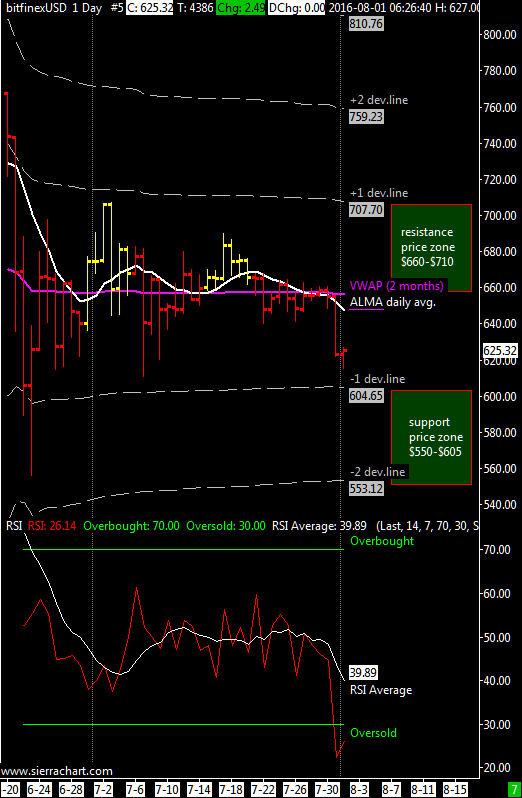
XBT / USD weekly range $605-$ 660 | ALMA daily moving average is bearish and the main resistance is the VWAP at about $ 660, first support at $605.
XBTUSD broke previous week support and is now in a weak position under $ 660 US dollars. The resistance zone is $ 660-710, I think that XBTUSD will remain below $ 660 this week with a second resistance at about $ 710. The volatility finally increased with a drop in the last weekend.
The weekly forecast remains bearish, I think we will continue to see the bitcoin below the VWAP at $ 660.
The only positive note is the RSI oscillator that entered in oversold territory after a while and could allow a bitcoin rebound in the next few days, rebound which should end at the VWAP ($ 660).
- Italian version here at Bitchanger
- I’m posting also at steemit, if you want to follow me there and upvote my posts click here.
