Weekly Range Update

eng
XBTUSD daily chart

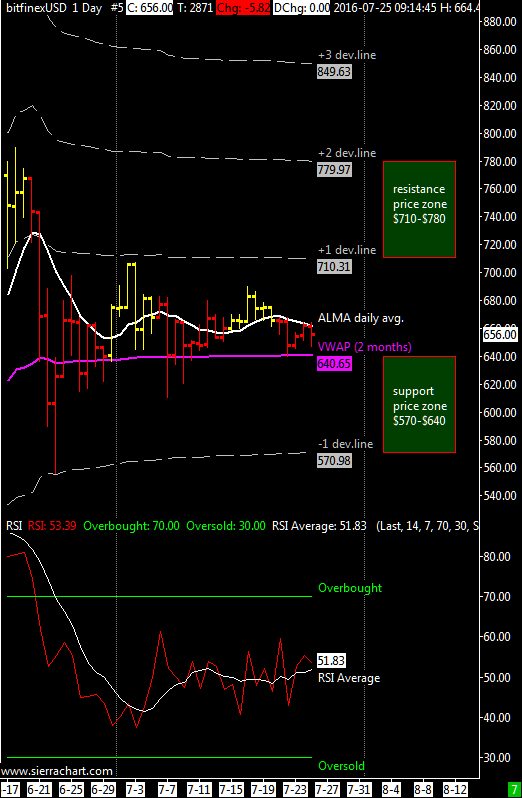
XBT / USD weekly range $ 640- $ 710 | ALMA daily moving average is slightly bearish and the main support is the VWAP at about $ 640. XBTUSD remains in bullish position always above the VWAP since June 24, last week it tested $640 and reacted from there but generally speaking we are in a flat congestion between 630 and 680 dollars, for short-term traders i recommend to trade this price range accordingly (between the two extreme of 570 and 780 US dollars).

The resistance zone is $ 710-780, I think that XBTUSD will remain above $ 640 again this week with a first resistance at around $ 680. The volatility continues to be very low and this will have to be solved sooner or later with a breakout above or below the price range defined by the deviation of the VWAP lines indicated in the graph. The weekly forecast remains unchanged, I think we will continue to see the bitcoin confined in this price range, between 640 and 710 US dollars.

The RSI oscillator remains in a neutral position around 50 although is slowly orienting for an upward movement.

Weekly Range Update

XBTUSD daily chart
XBTUSD daily chart

XBT / USD weekly range $ 635- $ 710 | ALMA daily moving average rose upward and the main support is the VWAP at about $ 635. XBTUSD resists above the VWAP for almost a month. The resistance price zone is $ 710-800, I think that XBTUSD will remain above $ 635 also this week with a first support at around $ 670, which corresponds to the ALMA moving average I use. It remains to be seen if market participants will manage to push the bitcoin price over the resistance at $ 710, the volatility after a period of contraction increased again and it did it by pushing up prices rather than downward, a positive note that leaves some hope for a break above $ 710.

The RSI oscillator remains in neutral position around 50, yet there seems to be a trend strong enough to move above $ 710, at least this week.

Weekly Range Update

Daily Chart @bitfinex exchange

XBT / USD weekly range $ 625-$ 710 | ALMA daily moving average is slightly bearish and the main support is always the VWAP at about $ 625. XBTUSD resists above the VWAP and several times the price has attempted to move below it without particular success, this support level (@625$) has been broken in some cases slightly and then quickly recovered. The resistance zone is $710-$800, I think that XBTUSD will remain above the $625 this week, otherwise I see the area $540- $ 580 as a very important one. $580 is the mid-level between VWAP and -1 dev.line at $540.

The oscillator RSI after having touched the oversold area has rebounded and now is in the neutral zone around 50. The halving of block from 25 to 12.5 bitcoins for now has not led to an increase in volatility.

Italian verso here at Bitchanger

Mid-Week Range Update

imageXBT/USD range till sunday $625-$740 | daily moving average is bulllish but slowing down and main support is at VWAP near $625 , i expect less volatility these days while the halving is coming next saturday. Eventually sunday after the halving the market might spike up to the resistance price zone 740-800 usd.

RSI oscillator average is near oversold territory and reversing to the upside, i don’t expect this market to move below $620.