
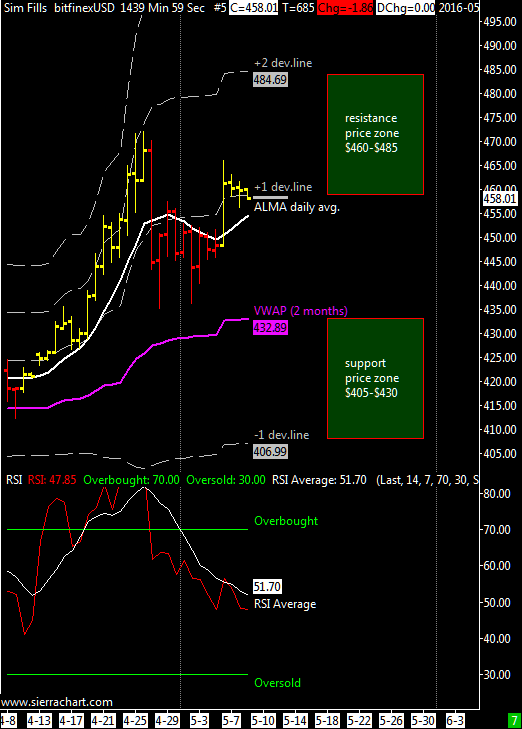
XBT/USD weekly range.forecast $435-$460 | daily moving average is bullish after the upmove of May 6. Strong support is always at $435 near the short term VWAP and there is also a recent double bottom. In case of another upmove strong resistance is at $485.
With my metatrader 4 price regression channels i’ve a similar picture with support at $424-435 and resistance at $463-475 price zones. Yellow line is the same average i use on sierrachart, ALMA moving average.


It looks like more overhead resistance could clear between May 16 and May 22 based on Gann harmonics. Those dates could represent a new paradigm in the same way that my 4/20 call represented the shift in paradigm from the $420s to the $450s. But overall, we’ve got a much better chance of seeing serious price action in the beginning of June when other global markets should get more volatile.