
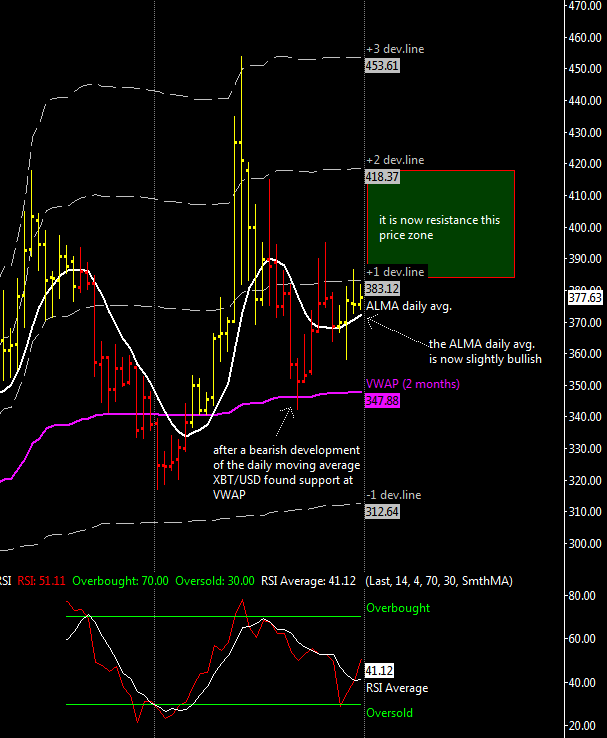
I don’t have much to say since my last update, this market remains confined in a price zone defined by my VWAP (computed using 2 months) and its first deviation line, why? probably because of the bearish indication from the daily ALMA moving average that i pointed out in the previous update (since then XBT/USD failed to make new highs above $400); average that is now slightly bullish after a VWAP test last 21 November at $350.
In the last month we have seen a sequence of three higher lows suggesting an underlying effort to go up with a possible target for December of $420, while support is always around my short term VWAP ($350).
The weekly ALMA moving average is now flat after more then 5 bearish months, it’s an improvement but not enough to confirm a long term reversal, we need patience but at least XBT/USD is trying to build a base for a bullish 2015.
