
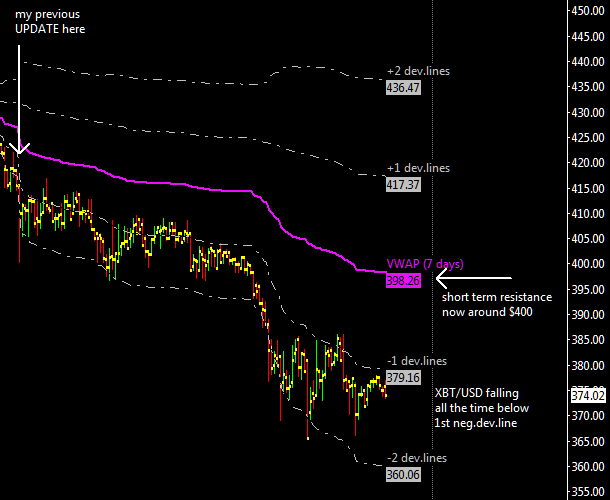
The market has failed a quick recovery above the short term VWAP and as I speculated in my previous update XBT/USD fell and made new lows; staying all the time under the first negative deviation line, as I have already said in the past this is bearish behavior. Short tern resistances at $380 and $400, next supports at $360 and $340. The price zone around $340 could be an interesting one for trying to catch a decent price rebound.
Month: September 2014
Short Term Update: Again Bearish
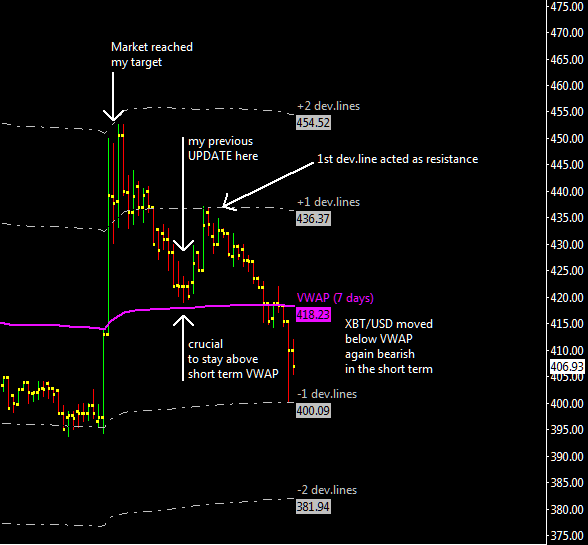
Here is a one hour chart of last 3 days, the market has rallied to the first deviation line that acted as resistance; I though this would be easy to pass and attack again the $450 recent top, but the market showed weakness moving again below my short term VWAP and found support at the first negative price deviation line.
I’ve seen a strong buying climax on paypal news when the market topped at $450 and since then it completely retraced down to $400 where the rally to $450 started. This is definitely a bearish behaviour and if XBT/USD fails to quickly recover the $420-$425 price zone i expect to see a further drop to $380 and possibly lower, to new lows.
Quick Short Term Update
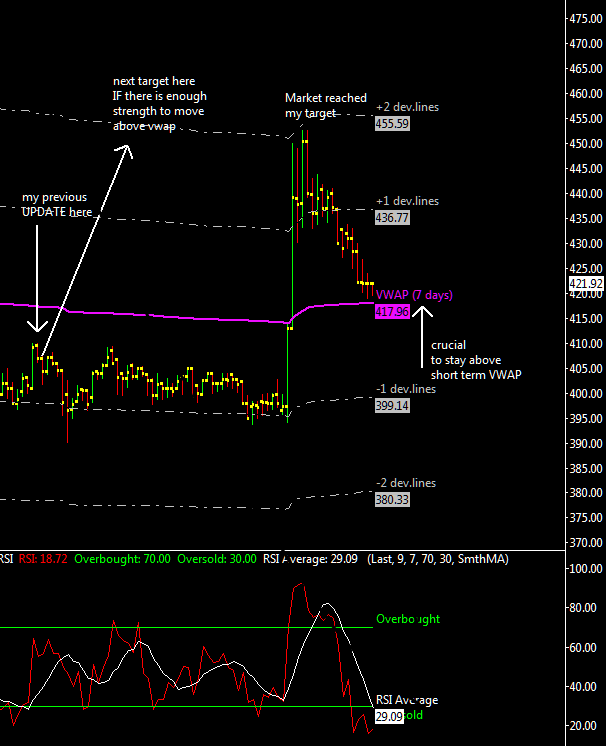
XBT/USD reached my forecasted target of $455 and it is now bullish in the very short term (one week horizon). It is normal to retrace back to the VWAP during the recoil phase of the cycle after a strong jump to the second VWAP price deviation line. I expect now a consolidation at or above $415-$420.
Short Term Udpate
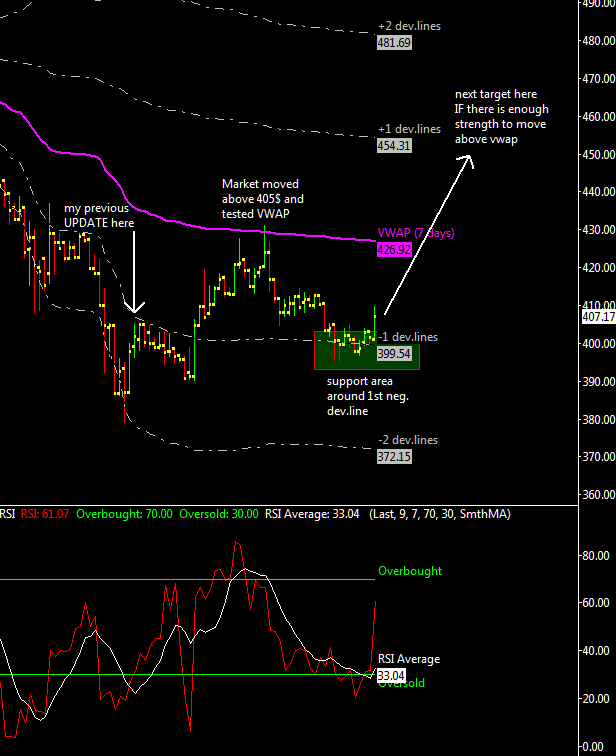 XBT/USD moved above the $405 resistance i’ve mentioned in my previous update, as expected it tested the quick VWAP average at ~$430 without enough energy to break above. This is again a bearish behavior but the bearish pressure is diminishing in intensity, as you can see from the attached chart now it is important for XBT/USD to stay above the indicated support area to prepare a new move to the next target, possibly at $455. If the $455 target is reached then I can start to consider $380 as a candidate mid term bottom.
Short Term Update
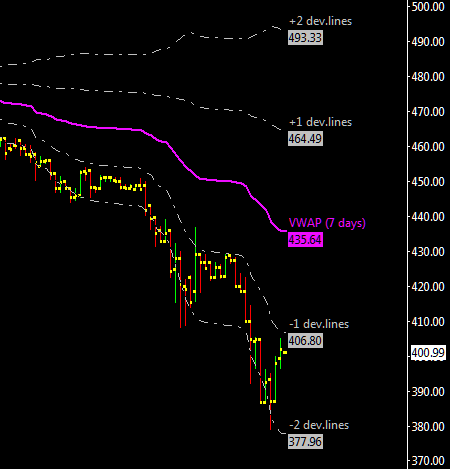
XBT/USD continues to fall without ever being able to overcome the first negative deviation line of the average that I use to follow the market in the short term. This is definitely a very bearish behavior, as you can see from the attached chart the first resistance is at $ 406, the next is my VWAP computed using last 7 days, at $ 435.
If the market can move up to $ 435 without going back below $ 405, we can conclude that at least in the short term the bearish pressure is loosening a bit, vice versa if it fails to overcome $405, the first available resistance, I’ve to believe that we will probably see new lows below $ 380. More updated information is available for who follow my IRC channel.
Long Term Update: bearish or not bearish?
Here is a daily bar chart that sometimes I use to keep track of a bull or bear market trend.
An interesting thing to note about this chart is that XBT/USD is below a dropping 200 days moving average (red line), a typical bear market setup. XBT/USD is also below its 50 days moving average (black line); both averages are dropping confirming the bear market.
Reactions within a bear market typically take a security above its 50 days moving average and up near its 200 days moving average. The 2014 June top is a good example of a reaction ending at the 200 days moving average and above the 50 days average. The position of the 200 days moving average should be considered as the upper limit of a rise within an ongoing bear market.
The first sign that the bear market is over would be a rise of XBT/USD above its 200 day moving average followed by a rally back to or slightly below the 200 day moving average which reaches a sideway or improving 50 days moving average; this configuration for example happened in april-may 2012 at around $5 for then climbing up to $15 in August.
Right now the market appears to be a bit away from this kind of bull market signal but not too much considering that XBT/USD can quickly rise up to or above 550 dollars (200 days average) even in a single day. This quick rise could reverse the 50 days average to the upside and in a couple of weeks reverse also the 200 days average confirming the birth of a new bull trend.
To conclude I think there is a lot of short term bearish sentiment in the market but the bullish news constantly hitting the headlines are increasing the odds of a sudden rise back to the resistances (both averages ranging from 525 to 550 dollars). Still, such a reaction might not be fatal to the bear market trend, so in any case we just have to watch the market’s behavior relative to these moving averages to draw a final conclusion about the bitcoin’s fate. I encourage everyone to add these 2 moving averages to their daily chart.
Many of you are probably asking to themselves if i suddenly turned bearish about this market, yes and no because i consider the 50 and 200 days moving average approach not a perfect one, it might be good for the stock market but for bitcoin that is a new market it might be different, Why? probably because of its insane volatility level that can quickly change the overall picture.
Personally as long as XBT/USD stays above the top of its previous cycle (April 2013 top at $266) and with a rising network difficulty I’ll never be fully bearish as i’ve already explained many times in the past.
NOTE: The attached below chart is the composite of four main exchanges: btce,bitfinex,btc-china and bitstamp.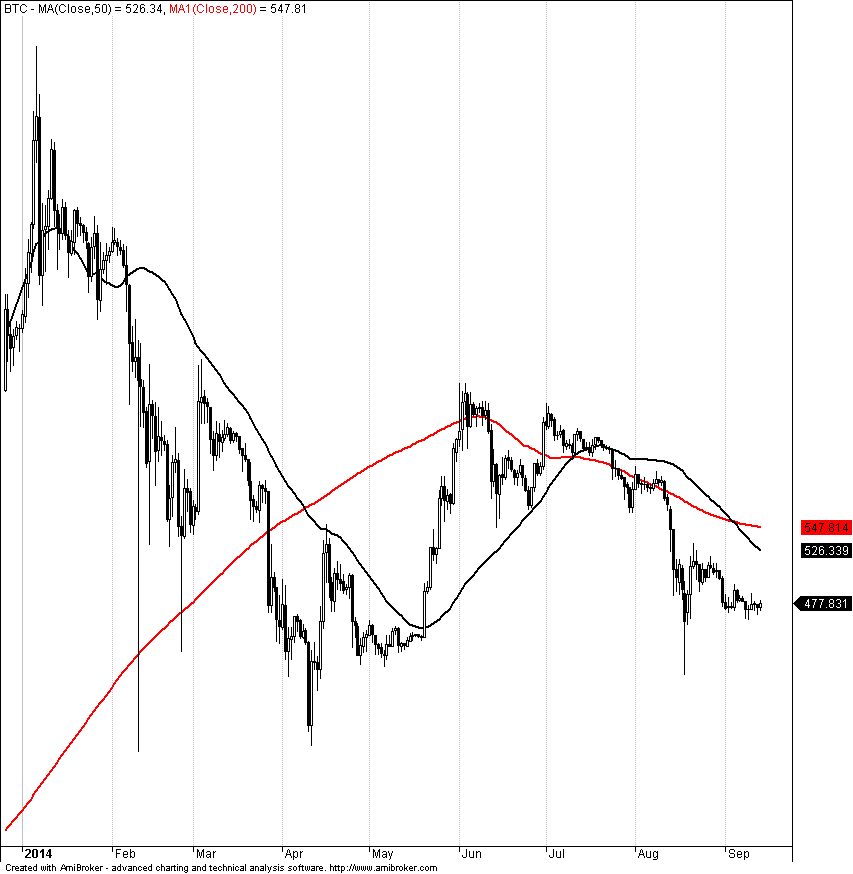
Short Term Update
Since my last update this market has bounced twice towards my short term volume average, this happened after the Paypal news about adding bitcoin support. The price zone from $455 to $465 is still working as support, any break below $455 would materialize my bearish scenario down to $420. The current daily cycle is still pointing there, to $420.
Paypal news is just the latest in a long series of positive news for the bitcoin environment but the market hasn’t reacted positively to these bullish news for many months, not to mention the null effect of Dell accepting bitcoins. This is definitely an abnormal behavior and it can only be explained by the low level of those who trade at the main bitcoin exchanges, they lack also of long term view on bitcoin and are here merely for short term speculation.

Short Term update: Failure to recover $500
In my last update i’ve talked about a mandatory condition to move above $500 soon but XBT/USD failed to do so and instead drifted further down towards the $455-$465 support area. At this point the odds are for a drop down to the $420-$430 price zone, below the recent bottom done at ~$440 because the averages i’m using on the 3 days chart and weekly chart are bearish and pushing down the price.
For the next few hours because of a low reading of the RSI there could be a rebounce to $480 where there is the fast VWAP (7 days), notice how the second negative deviation line provided temporary support to the price action at around $465.

Short Term Update: Time is Up

In my previous update I hypothesized that the drop of last 31 August could have been a true breakout but at the same time i was leaning towards the shakeout theory, at this point considering what happened yesterday i have to remain moderately bullish for the upcoming days but there is a condition that must be met in order to move up to the first decent resistance, the VWAP at around $550.
This condition is to move above $500 soon, better this week, because with the weekend ahead i’m worried that there could be a new stall with a subsequent drop. Where will bitcoin found support in case of a furhter drop from here? Well the support for the second part of the month could be in the $420-$430 price zone, below the recent bottom done at ~$440; this possible scenario scary me a bit because moving below the previous bottom would have very bearish implications and i prefer to avoid complications.
OFFTOPIC: join ##btctrading on freenode
The #btctrading IRC channel
##btctrading is a place where many traders hang out and discuss about bitcoin market analysis. The community in ##btctrading will be mostly the same community that you’ll find here in the comments.
Download an IRC Client
A popular open-source option for Windows / Linux is Xchat: http://xchat.org
Mac users might want to consider Colloquy: http://colloquy.info
Connect to the FreeNode Network
Once you install the application you’ll want to connect to the FreeNode network. FreeNode.net is a network that is very popular with open-source development communities. Most web-development frameworks have an IRC channel on FreeNode so we’re in good company.
To connect to FreeNode set your IRC client to connect to the server irc.FreeNode.net by setting it in the client’s user-interface or by entering the following line in the input box:
/connect irc.freenode.net
Join ##btctrading
From there you can join the btctrading channel using either the IRC client’s user-interface or by entering the following line in the input box:
/join ##btctrading
NOTE
Again I please everyone to join the unofficial channel using the double # as prefix (##btctrading), thanks.
Why? well because of freenode rules on primary channels at the moment i decided not to use #btctrading, more here.
