
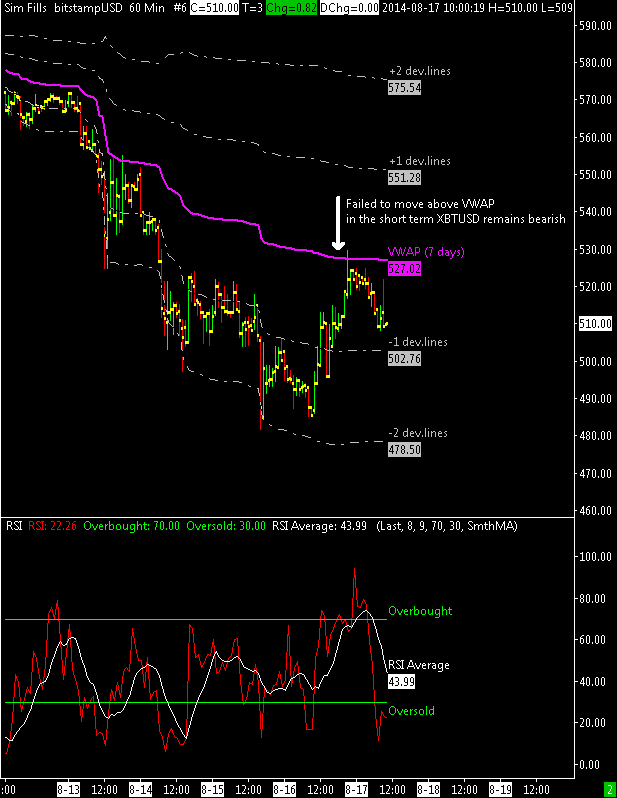
 The recent sell off has brought the bitcoin into some decent short term support; the top chart above shows the XBT/USD coming into support that is defined by the first deviation line of VWAP, computed using only last 7 days of data for a very short term indication.
The bottom pane of the chart shows the RSI in oversold territory but its average is higher and this let me think that there should be a retest of the $500 support level.
It would appear to me that strong support in the near term comes in around the $470-$480 price zone while resistance is at the VWAP, now at ~$530.
I don’t expect to see bullishness soon but there is the possibility that if $502 will hold then bitcoin will have enough energy to recover the $550 level before dropping again.
