
 In my last update I had suggested a decline in prices in the $520-$580 price zone and it duly happened:) why? Well sometimes i forget that this market is very sensible to news with a strong tendency to overreact. It is enough a modest bearish news that the majority of the trading community lose control to their emotions and cannot make up their own minds, feel free to call it the sheep effect:)
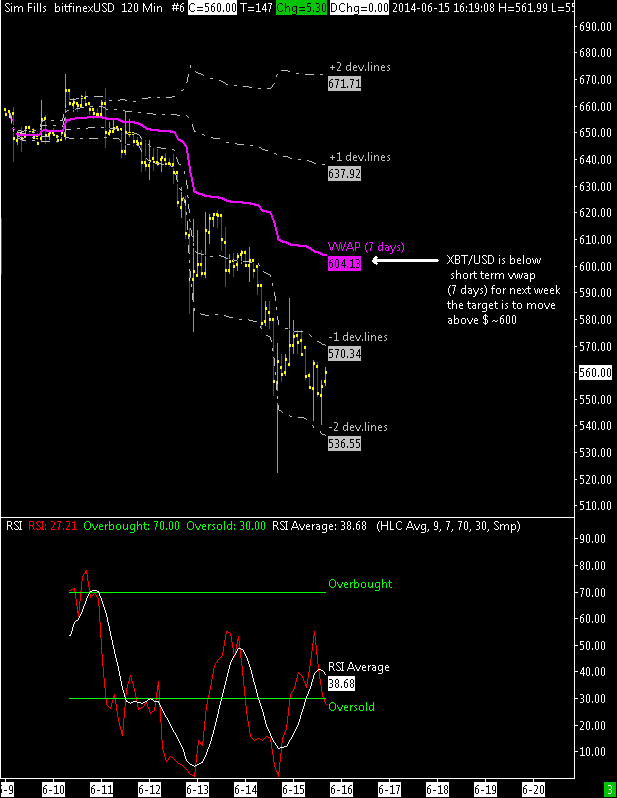
As you can see in the attached two hours chart now XBT/USD is bearish in the short term with the weekly VWAP acting as resistance at about $600.
The target for the next week is to move again above VWAP to regain a bullish position, while an immediate further correction below $520 would be bad IMO with some bearish implication also for the long term trend.
To conclude, i expect a rebounce up to $600 for the next 72 hours.
