
 This is a weekly chart (bitstamp data) since August ’13, it is important to analyze the weekly chart and the net volume , weekly charts have much less noise and if you are using the daily and weekly charts for your trading, always look at the weekly first.
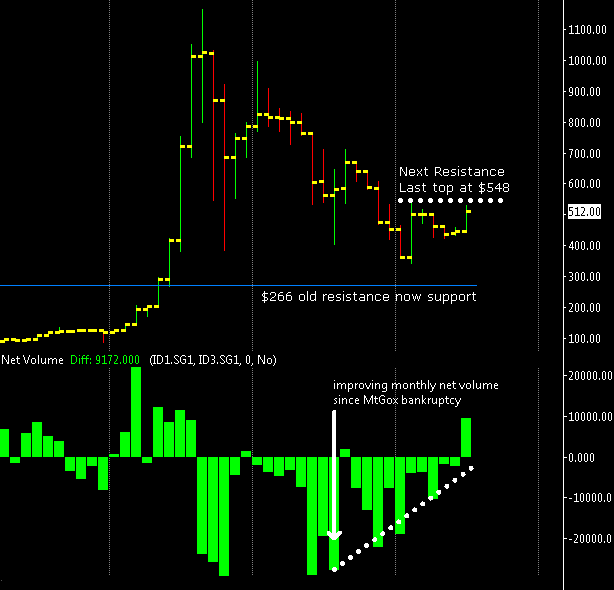
Here this chart is telling us that this market is slowing down its fall, the net volume activity peaked during the MtGox crysis and the subsequent bankruptcy in late february. Since then the net volume slowly started to improve and the selling activity was already diminished when this market bottomed out at $340, first divergence to note.
Now with the recent move to $520 the net volume is in positive territory but i think that it is not enough to put an end to a very long price correction of 5-6 months; the risks of a classic pump and dump move is high, because i think that the recent 15% surge in prices has probably been orchestrated by a single big investor.
Before opening a long term trade i’d like to see at least 2 weeks of consecutive positive volume activity and XBT/USD moving above previous top of $548.
Note to readers: As usual I’m open to your comments.
