Long Term Update: 3 days chart

chart
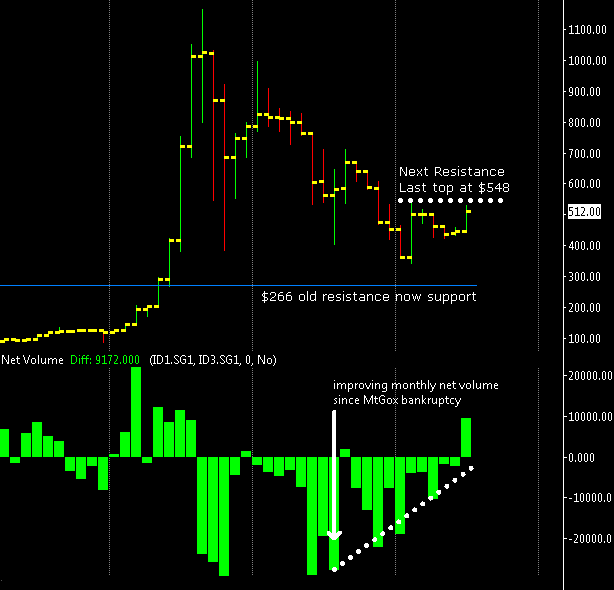
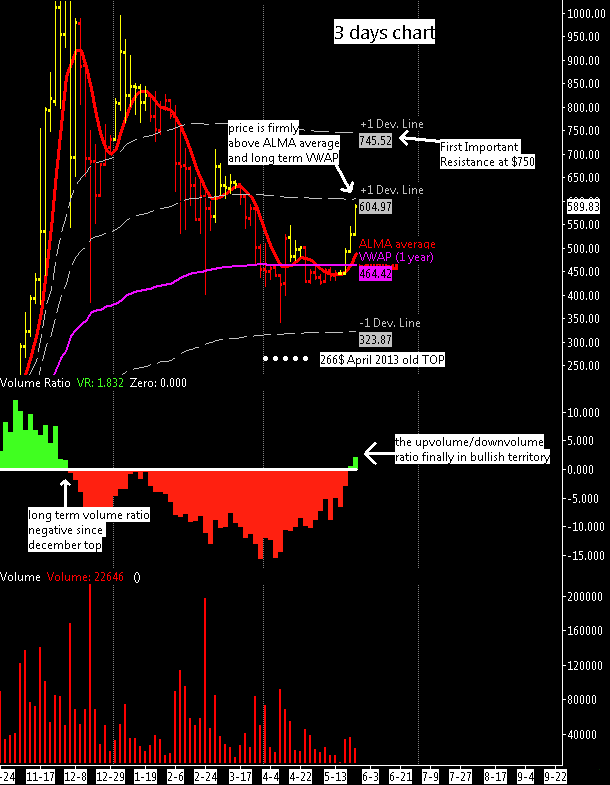
I’ve decided to buy after a strong breakout of the previous intemediate $548 top. I report here the 3 days chart with the up/down volume ratio finally bullish after more then five months of bearishness, I think this is a very bullish signal for the long term. It is pretty obvious that for a better confirmation we need to move above the $710 top of March ’14.

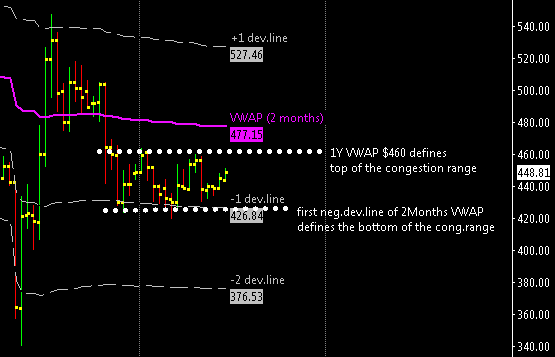
Looking again the one year VWAP and its deviation lines i think that the next important resistance area will be at $750 where probably sellers will show up again. Now XBT/USD is near the first positive deviation line but i think there is enough fuel to move above $600, in any case there could be a break of $50 from here down to $520-$530 where i’ll probably open a second trade averaging down my position.

Averaging down a position it is often considered a bad mistake but i’ve a different opinion. In books and information about trading all say the same things, that you should never averaging down a losing position, etc… Well they strongly emphasize that money management is a key aspect , they always tell you that it is dumb to average down, to always use stop losses, risk 3% of your account and so on,  it is something like a never ending recycling of bad ideas used by the retail traders that produces the illusion of certainty.

Because 95% of traders always fail you have no choice to do exactly the opposite to succeed ; under some circumstances, averaging down can help you to mitigate the uncertainty of market speculation and allow volatility to produce profits for you without the need to be a guru in divination.

Long Term Update: Long term Buy? not yet

chartThis is a weekly chart (bitstamp data) since August ’13, it is important to analyze the weekly chart and the net volume , weekly charts have much less noise and if you are using the daily and weekly charts for your trading, always look at the weekly first.
Here this chart is telling us that this market is slowing down its fall, the net volume activity peaked during the MtGox crysis and the subsequent bankruptcy in late february. Since then the net volume slowly started to improve and the selling activity was already diminished when this market bottomed out at $340, first divergence to note.

Now with the recent move to $520 the net volume is in positive territory but i think that it is not enough to put an end to a very long price correction of 5-6 months; the risks of a classic pump and dump move is high, because i think that the recent 15% surge in prices has probably been orchestrated by a single big investor.
Before opening a long term trade i’d like to see at least 2 weeks of consecutive positive volume activity and XBT/USD moving above previous top of $548.

Note to readers: As usual I’m open to your comments.

Long Term Update: again Congestion

As i said recently, a congestion occurs when four consecutive bars open or close within the range of a “measuring bar”. A “measuring bar” becomes such when its price range contains the opens or closes of at least three of four subsequent price bars,  I consider the daily bar of last 27 April the measuring bar with the range from $430 to $460.

We can say that it is a congestion because we have been inside the measuring bar for 18 daily bars, more then 20 bars it is a Trading Range with a breakout usually occurring before the thirtieth bar.

I expect to see a breakout in the next two weeks also because of what i wrote about the length of the correction started in December ’13; I think that this congestion will not last more then 30 days in a volatile market like this. Top of the congestion range is also the one year VWAP now at $460.

chartIf XBT/USD will break below the congestion range, i still think that the $370-$390 price zone will provide some support.


Short Term Update: H2 chart at BitFinex

chartSince my last short term update XBT/USD topped at ~$460 and retraced back to the weekly VWAP, the RSI oscillator is oversold now so i’ve to conclude that there will be a new upswing from here.
Well when it is too easy there is always something wrong, i think there could be a further drop to the first support line at $430 before we see any upside; don’t forget that $427 is also the first negative deviation line of the 2 month VWAP, i think that for the next days this price zone should hold (around $425-$430).

For all the readers of this blog that likes to do short term trades i recommend to watch out that support area i mentioned before with the idea to close at or above $440, in any case it’s better to use a tight take profit because of the overall picture not yet bullish.
The stoploss should be tight as well, if this market breaks below $420 better to quit the position or open a short position up to the next support at $375-380.

Short Term Update: bitcoin is showing some sign of life

chartThis is a four hours chart using BitFinex, i’ve decided to move there but it’s a temporary decision, i’m not particularly ecstatic about an exchange that used the stolen code of bitcoinica as a starting point. I decided to ignore hitbtc because they are blatantly faking volume activity since mid april; an unfair practice that i really hate. I’m currently exploring also ItBit, the Singapore based exchange, it could be my next choice.

XBT/USD is showing some sign of life after it moved above the weekly VWAP, it could be the first step for a long term reversal as long as it stays above $440. I’ve noticed that also the weekly net volume recovered from a very bearish situation back to neutrality and the two months VWAP is not so far, currently at $480.

Many investors and traders are waiting a further drop below $400 and possibly lower, a couple of weeks ago i was waiting a drop to $300 but the market stopped at $340, at this point I’m not so sure that this market will satisfy us with a further drop considering also what i’ve said in my previous update about the length of this correction started last December. I smell the possibility of a market upmove coming soon and against the expectations of all with the effect of surprising everyone.

Time is running out

I report  an analysis that take an historical perspective of the XBT/USD, using MtGox data for the period before the inception date of the Bitstamp exchange. The effort of this short analisys is to understand how much it’ll last the current decline in prices started 5 months ago.

I reported here all the most important past swings of this market, not always considering the absolute highs and lows but the upward and downward phases of the market which can include periods of sideways activity.

The earliest days

In 2010 the main exchange was MtGox, it opened in July but available data starts from 17 August.
Up to the first days of october the price stayed flat at $0.06 then rised significantly to $0.50 the 7 November. A correction followed with a low at $0.17 after 32 days.

The next swing carried bitcoin from 17 cents up to $1.09 (9 Feb. 2011) and again a correction, longer this time, 54 days down to 56 cents, it was april 2011.

The First wave

Everyone here probably remember the insane upswing that went from below 1$ up to 32$ of  June 2011, from this top bitcoin entered a bear market that lasted 162 days, till november 2011 where it bottomed out at $1.99

From this bottom a new upswing happened up to $7.2 (8 Jan ’12) , again similar in length to the previous ones: 52 days. This market then stayed sideways for 145 days, when the first days of June a new uptrend moved bitcoin up to $15.4, in August ’12 after 77 days. For the second time in a year we have had another phase of  flatness prices that lasted 139 days similar the previous one of 145 days.

The second wave

The first days of 2013 another upleg started from $13 up to $266; 97 days the longest upswing ever for bitcoin. After a period of huge volatility till July of the same year , prices stabilized at around 100-120 dollars and this consolidation ended 12 October after 185 days. So far we have had 6 consolidations with an average duration of 126 days or 158 days without considering the earliest days of bitcoin.

The last wave

This is the latest part with the solid rise from 140 dollars of October ’13 up to $1163, the bitstamp all time high done 49 days later. Since then 156 days are passed and comparing this value with past values i believe that the actual consolidation phase is coming to an end.

Eventually this correction might last as the previous one that lasted 185 days, this will project the end of the actual correction phase something around June 2014, one month from now.
Beware that this forecast doesn’t necessarily means that a new bottom will develop because as i said earlier i haven’t considered absolute bottoms in calculating the duration of all the past price consolidations; it just means that probably during next June a new uptrend will start.

Time will tell.