
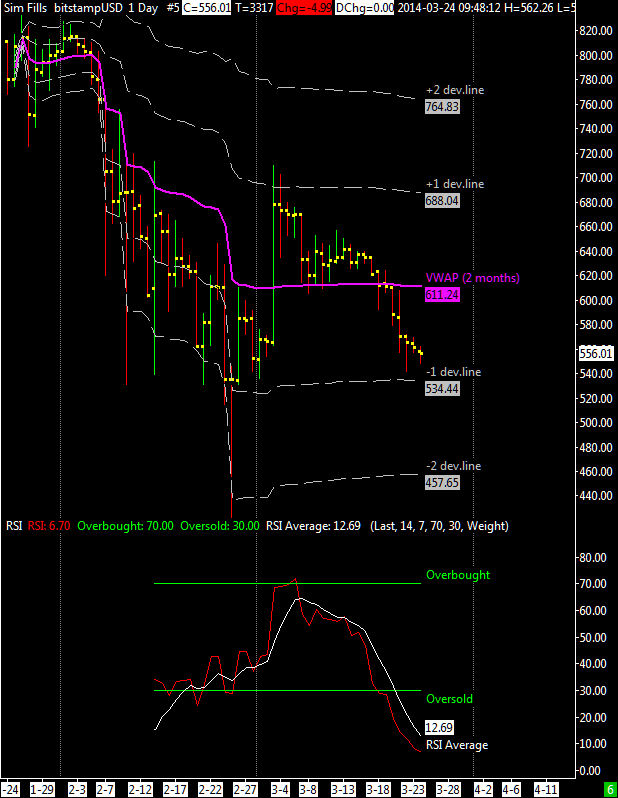
 After failing to stay above my weekly moving average ($616) and VWAP computed using last 2 months ($611) the XBT/USD moved back to a short term downtrend with a lower top at $631 (12 March) after the previous one of $710 (3 March); supports are now at $534 and $457 as indicated in the attached chart.
RSI is very low, very oversold and at this point i’d like to see a decent reaction at least up to the VWAP at 610 dollars but i’m not so sure about it because of the overall bearish outlook on a weekly basis. I think that the market might break below the 541$ recent low because of a big descending triangle that it is forming on the weekly chart, and moves all the way down to the $440-$450 price zone where i think strong buyers will come back for a new buying opportunity.
Bearish Scenario
If this market decides to move well below my long term $440 support I think it will spend there the right amount of time required to scare weak investors, forcing them to sell their bitcoins to long term experienced investors.
Where? The final bottom should be probably above the April 2013 top at $266 but as long as XBT/USD stays above my $440 long term VWAP support this bearish scenario remains only an hypothesis.
