
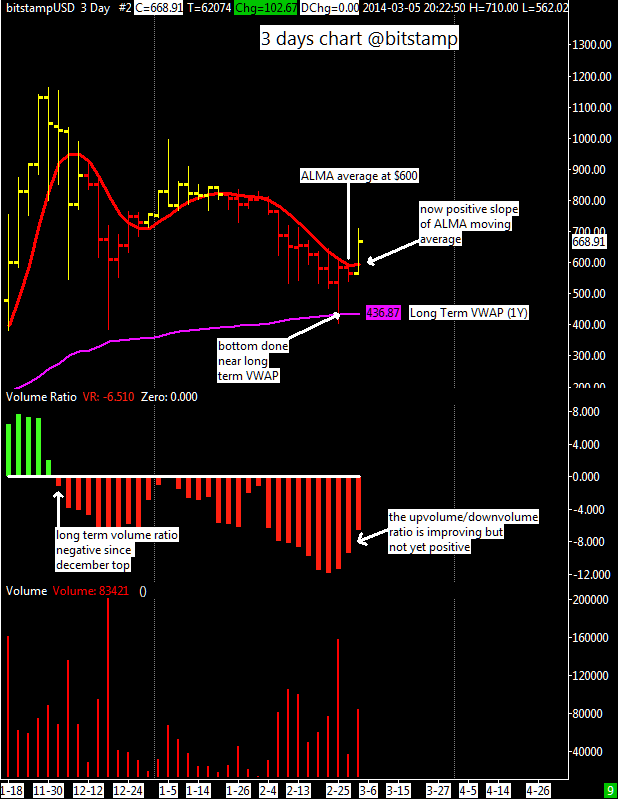
 Since my last update XBT/USD showed strength above $600 this means that the short term bearish trend is almost over but I need to see the upvolume/downvolume ratio computed on a 3 days chart becoming positive before opening a long term position.
Another positive aspect is that the ALMA moving average slope is now positive, an important bullish sign. For an investor who wants to play very safe with their money i recommend to wait a confirmed bullish volume activity because, as I said before, the up/down volume ratio is still negative; why? Well because it’s not enough a strong and quick spike up to $710 to erase weeks of weak market performance.
The intentions of the market to goes up must be confirmed with solid buying from investors but for who wants to try to anticipate the market i recommend to place a buy order in the $600-$620 price zone, in the short term this market should found support there, above the 3 days ALMA moving average now at $605.
