
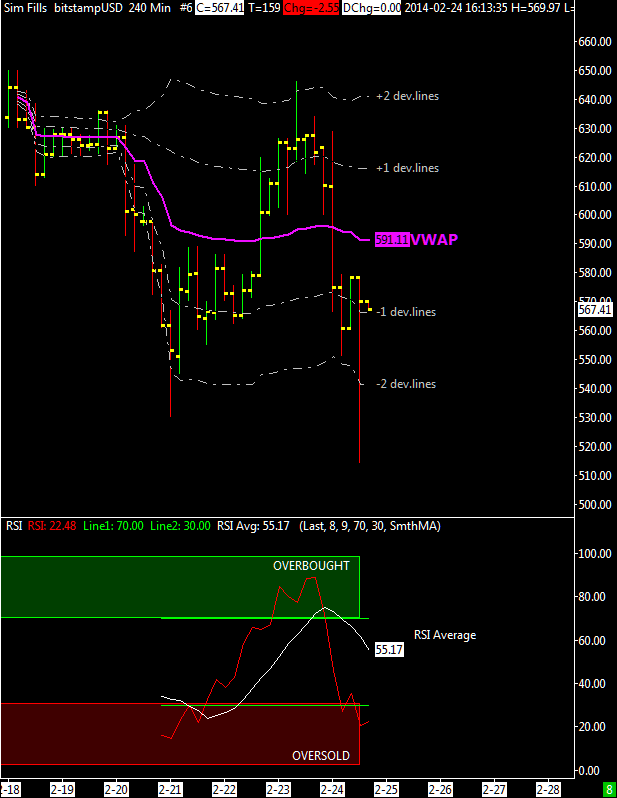
 The recent sell off has brought the bitcoin into some notable short term support that I believe deserves attention. The top chart above shows the BTC/USD coming into support that is defined by the second deviation line of VWAP, computed using only last 7 days of data for a very short term indication.
The bottom pane of the chart shows the RSI in oversold territory but its average is higher because of the 5k bitcoins dump just happened at bitstamp.
It would appear to me that strong support in the near term, comes in around the $500-$520 price zone while resistance is above the VWAP, now at $590.
I don’t expect to see bullishness soon, i’m still looking for a long term bottom around $420.
