
 Congestion occurs when four consecutive bars open or close within the range of a “measuring bar”. A “measuring bar” becomes such when its price range contains the opens or closes of at least three of four subsequent price bars. As i said in one of my old post sideways price movement may be broken into three distinct and definable areas:
- Ledges – less than 10 price bars
- Congestions – 11-20 price bars
- Trading Ranges – 21 bars or more with a breakout usually occurring before the thirtieth bar
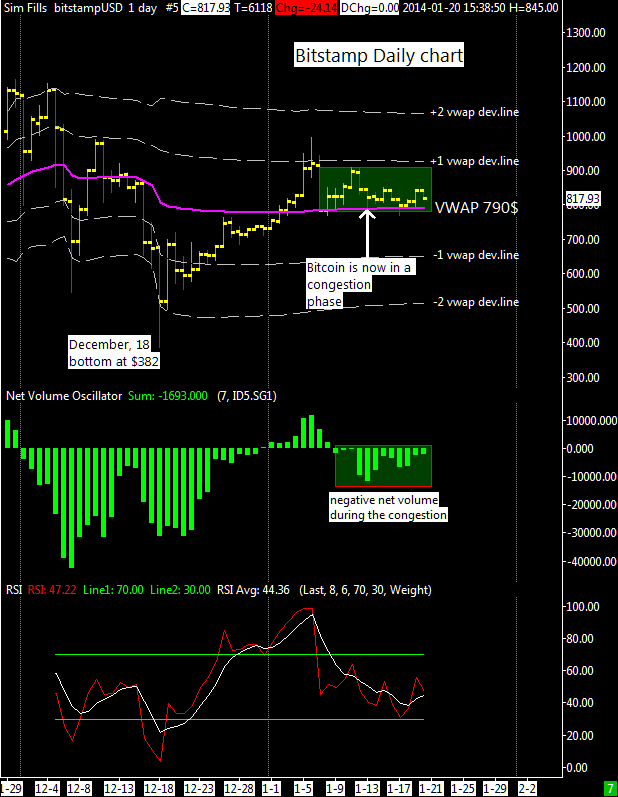
Now 13 days are gone without a breakout above or below the “measuring bar” (i consider the bar of last 7 January the measuring bar) and we are in a congestion; I don’t think the market is still following the triangular descending pattern that I mentioned in the previous update.
I expect to see a breakout in the next 5-10 days, unlikely that this congestion will last more then 20 days in a volatile market like this. Top of the congestion rectangle is the first deviation line of VWAP around $930, while the $765 static support just below the VWAP defines the bottom of the trading range.
I think that without a really bad news investors will not sell their precious bitcoins under $750, I believe that the positive sentiment of the market will slowly push prices higher outside the current congestion, possibly above $900 and toward new highs but this process will require some time.
