
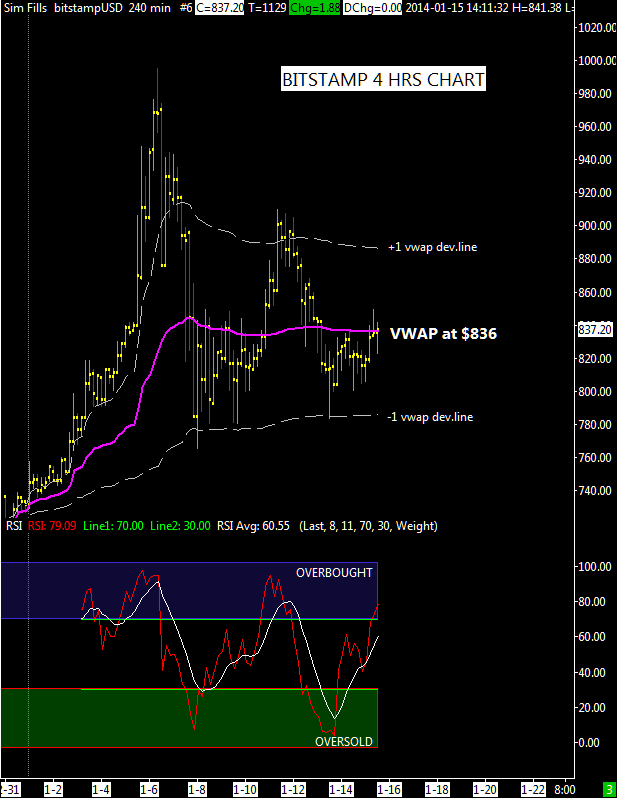
 This is a four hours chart of this month, it is visibile a descending triangle pattern forming up. Well i’ve read here and there about this pattern with lots of people worried about it, but usually this is a dangerous pattern when there is a clear downtrend and it’s not the case here, we are in an uptrend since last 18 December.
There are instances when descending triangles form as reversal patterns at the end of an uptrend, but they are typically continuation patterns.
Regardless of where they form, descending triangles can be considered bearish patterns that indicate distribution but, at the moment, i don’t see a strong negative lecture of my daily “net volume” indicator, instead it is improving.
Second thing to consider is that this month we have had many positive news, also today the French Senate hearing on bitcoin has been positive, in my opinion.
This triangle is going to complete itself before next 20 January, before this date it will break somewhere below my strong support at $785 (where there is also the daily VWAP) or above the descending trendline that defines the triangle, for the next days around $860.
Both levels are near vwap deviation lines of the short term 4 hours chart here attached.
As usual, I’m open to questions and comments, thank you.
