
 A couple of days ago one of my reader asked me about price and volume divergence, i decided to answer to him with this post talking again about it.
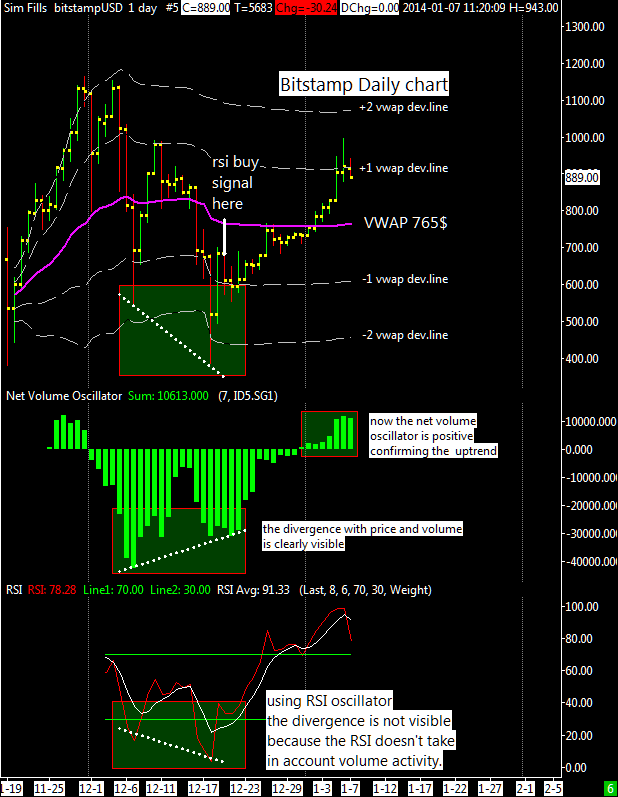
All the readers that follow me since 2011 know that i use a “net volume” indicator to understand the activity of buyers and sellers, it is computed taking the difference of a security’s uptick volume minus its downtick volume over a specified period, here i compute it on a daily basis with a 7 bars summation (an entire week because it’s a daily chart).
Often traders use such an indicator to judge the momentum or trend of a security in order to make assumptions about its future price movements. Net volume is an indicator that is also very similar to the idea of money flow and its indicator, the money flow index.
Now BTCUSD is hesitating around a price resistance (first positive deviation line of VWAP) but net volume is positive and till it remains positive i do not expect to see stronger down movements in the price, although we might see some consolidation beetwen the VWAP at 765$ and the actual price of $900.
