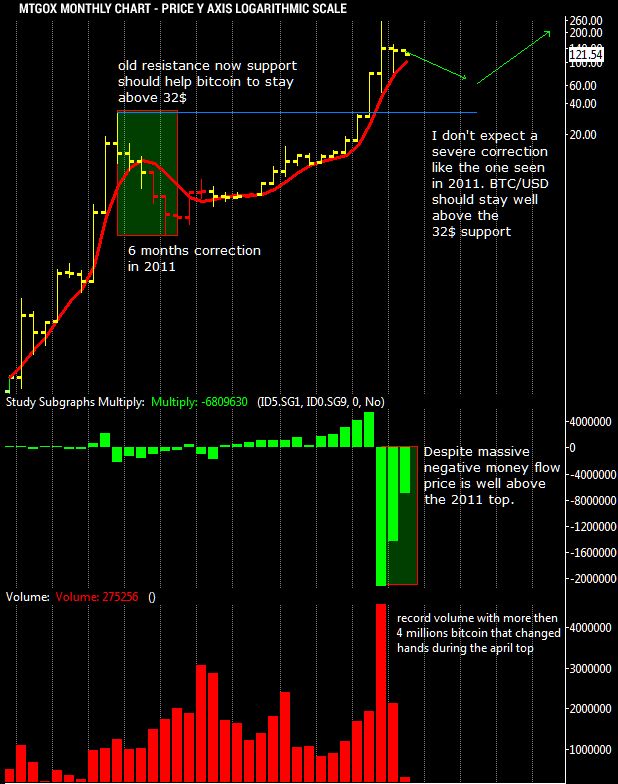
For the first time i show here a monthly chart, now that we have enough data since July 2010 when MtGox opened its “doors”. After a 9 months strong advance from 0.06$ to 31.91$ BTC/USD entered in a bear market that lasted 6 months down to 1.99$ in November 2011, since then we have seen a very strong rally and two accumulation phases spent at 5$ and 10-13$ up to January 2013. This year behaviour has been extraordinary with prices advancing from 13$ all the way up to 266$ that i consider it an important top like the one seen in 2011. I don’t think that this year BTC/USD will go above 266$ again, what i expect now it is a mild correction.
Keep in mind that despite the massive negative money flow seen during the drop and record volume bitcoin is still well above 100$,because of this interesting divergence i don’t expect the same extreme correction happened in 2011; i’m more for a slow retracement with a final bottom above the 32$ 2011 top, and even above the recent 50$ double bottom.
Apart any considerations about volume activity there is also the fact that until mining power or network speed will not give signs of slowing down the price will not come down easily. In 2011 only in august the network speed started to fall and bitcoin crashed from 14$ to 2$ and even if now the network speed might slowdown and retrace a bit it is not excluded a flat phase of this market instead of a steep fall. It is interesting also that there are too many players out there waiting for a big drop to 30$ but the market isn’t here to satisfy all their desires and most of the time it follows its path and not what the masses expect.
Unlikely that there will be a repetition of 2011 “pump and dump” pattern but, just for your curiosity, it is easy to forecast the bottom, using a logarithmic scale and projecting the same extreme drop from this year top at 266$ the bottom should be around 18$.

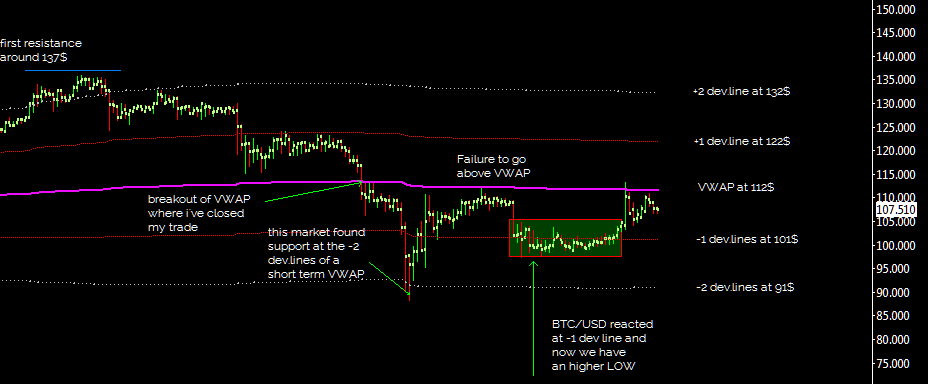
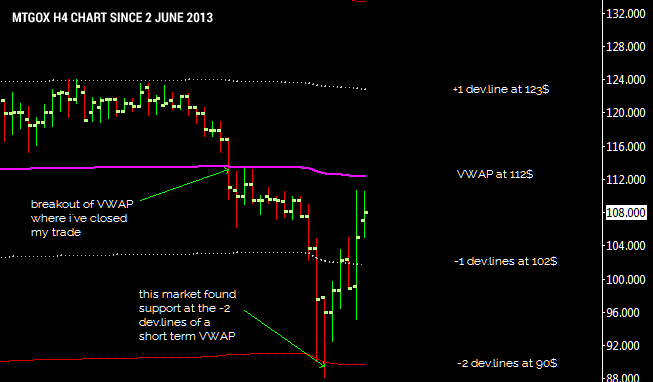
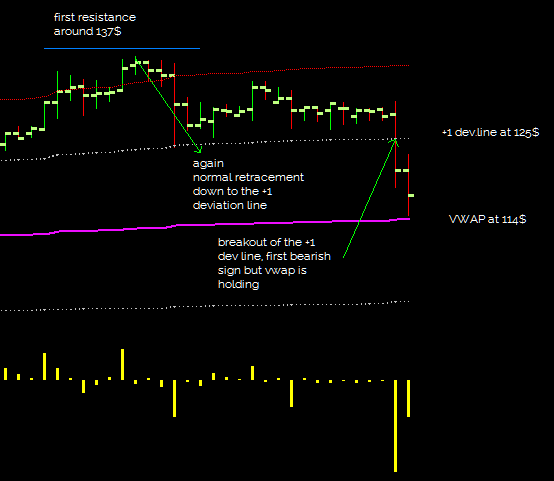
 This is a view of this month and it is visible that BTC/USD failed to go above the short term VWAP level at 112$ (now 111$); i’m worried of the recent weak behaviour and i’m starting to have concerns about the health of the long term uptrend but as i stated in one of my previous long term update i still think it’ll not go under 50$ this summer.