
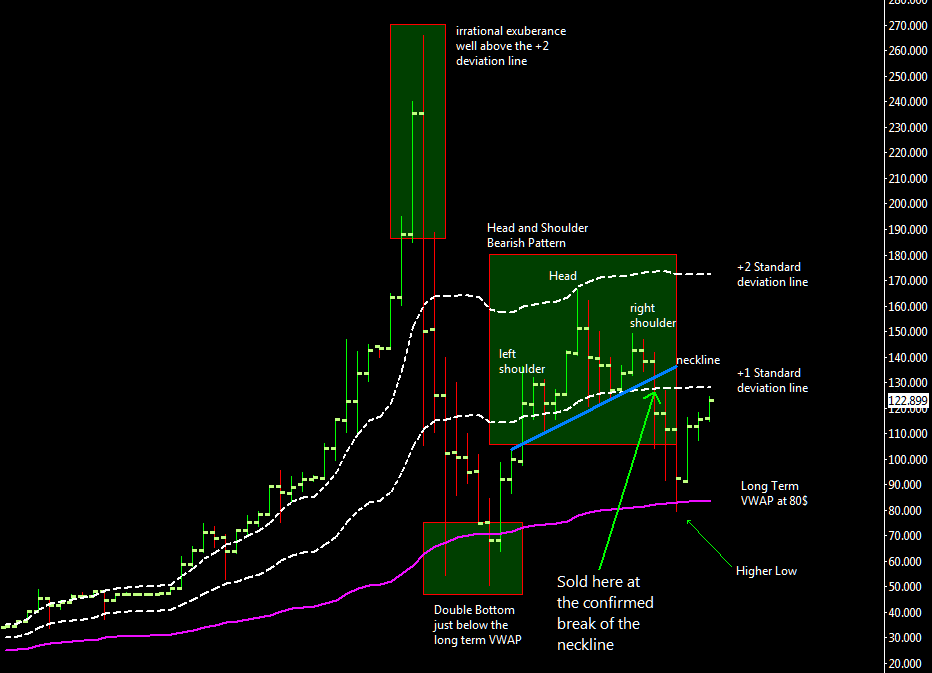
 The head and shoulder pattern is one of the most common reversal formation, while it is preferable that the left and right shoulders be symmetrical, it is not an absolute requirement, in fact the slope of the neckline (pointed out in the attached left chart, click to enlarge it) will affect the pattern’s degree of bearishness; a downward slope is more bearish than an upward slope, in this particular case the slope is telling us that it’s not much bearish and indeed the market bottomed out at 79$ near the level that i indicated as a potential support in one of my previous update and exactly at the long term VWAP (computed using last 3 months of data) without a severe crash under 50$.
This pattern helped me in the decision to close my long term trade 5 days ago at 128$.
Looking the big picture i think that this market it’s still bullish in the long term as long as it stays above 80$, another bullish indication is that the recent bottom has been higher then the double bottom made in April, now BTC/USD is approaching the first deviation line at about 130$ and it’s crucial to go above it with a good volume breakout. A failure to conquer the 130$ level would be a first warning of a downside move, probably headed below the recent 79$ bottom.

Hi Enky,
Sorry for bugging you so heavily..
Let me just ask one last question: In Sierra Chart I got the ALMA running with the help of Kiwi’s dll: http://www.sierrachart.com/supportboard/showthread.php?p=166619
However, I cannot find any option to set up the +/- 2 stddev of ALMA. There is an option called “stddevALMA (SG5)” but when I enable it, it doesn’t display. Can you help me here?
There is an study called Standard Deviation Bands, but this obviously has no connection to the ALMA plugin by kiwi from the link above.
Other than that, when looking at the Inverse Fisher and ALMA up-/downtrend indicators, it looks like almost all larger up and downswings can be predicted – really cool. This is very valuable. With the trading API working in the near future, I hope it will be possible to set up some automated trading based on those indicators. Sierra is much better than what is visible at e.g. http://bitcoinity.org/markets/mtgox/USD. Although I like the market depth chart at bitcoinity really much as it shows resistances in the market pretty good. I did not manage to get this displayed in Sierra Chart so far. The DOM graph on the right is pretty small and not telling much compared to the bitcoinity one. Any tips for improvement on this side?
Again, thanks for your help and sorry for bugging that much 😉
Hopefully this will also help other readers in setting up Sierra Charts.
Best
Steffen
Hi Enky,
For the VWAP, why not use a rolling 30 day window instead of resetting at the begining of every month?
When you reset at the beginning of the month, what do you do to make decisions since VWAP and price will be at the same point.
Would you say VWAP and stdev lines are one of your strongest indicators?
ERich
I noticed that you mention in your technical background that you refer to ALMA, and price momentum using an oscillator.
It seems that you now weigh more heavily on VWAP and stddev, is that correct? or do you use both?
also although you reset your 30 day window every month, you seem to keep a moving 3 month VWAP?
Hi Enky,
Don’t you think technical analysis isn’t that good for cryptos?
Hi Enky,
My 3 month VWAP (Feb 8- May 8) comes to 88…. i’m curious as to why our numbers are so far apart. Is the start of your 3 month on Feb 8 and end on May 8?
Erich
Have you noticed the triangle that’s been forming? It’s typical of a correction Elliott Wave (Wave 2 or, more often, Wave 4). This, combined with the new exposure happening in China, makes it more likely the triangle will break to the up side.
Do this say something to you? http://imgur.com/4tGKJNj Could be the beggining of a new bigger rally
Changed my opinion: http://imgur.com/9S2Gr8X
Hi,
I am curious to what software you use for creating charts and how much background you have in the trading business? Thanks 🙂
Ryan