Short term Trade: H8 chart at MtGox

UploadImage
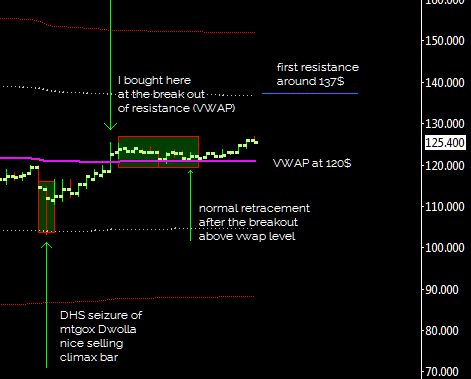
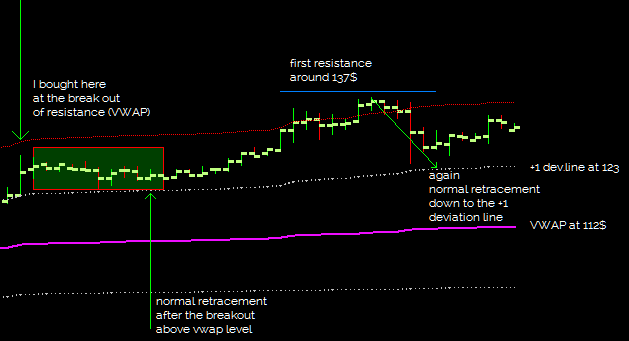
Since last update BTC/USD rised up to my first resistance at 137$ and fall back to support at the first deviation line. The volatility is remaining at low level and because of this i’m going to keep open this trade, i’m confident the price will stay above my entry point at 123$. I’m trying to carry this short term trade up to 145$-150$ where i’ll probably sell.

For who has followed my last trade i think that is up to to you how long to carry this trade before exiting because every trader has his own unique money management strategy, so if you are unwilling to risk more just close at profit now at around 130$:)

Short term Trade: H8 chart at MtGox

This is a view of last 10 days, each bar represents 8 hours. VWAP levels and deviation lines are computed using last 30 days. I’ve bought on a price breakout at 123.4$, after a normal retracement above the vwap the BTC/USD has resumed the rise. I think the first strong resistance will be around 137$ at the first deviation line, the second one is at 150$, a more serious resistance to be broke with some difficulties. The volatility dropped to very low level and i consider it a good thing for the overall stability of the currency; with current level of volatility it will require time to reach 150$, at least one month. For this week support stands at 120$ and resistance at 137$.UploadImage

Short Term Update

UploadImageThis is a short term view of May, as usual i added the VWAP and deviation lines. After two failed attempts to break the upper channel line at 121$ the market is now consolidating in a narrow range around 115$. Despite this congestion phase i think that BTC/USD is preparing a new upside move, why?

Well, i’ve learned in many years that positive reaction to bad news tells you that investors sentiment is bullish because they minimize bad news and emphasize good news.  The ability of Bulls to maintain a sequence of higher lows (bottom at 79$,97$ and 104$ after the bad news of MtGox in USA) does suggest a major move to the upside. A breakout of 120$-125$ resistance price zone will probably convince me to open a new trade.

To conclude it’s always hard to say on which direction BTC/USD will break but i must consider that the underlying long term trend is still UP. Thus,  i’m tempted to say that this price congestion will probably resolve in an upside breakout of the vwap upperline.

2 Years Anniversary!

Today marks the Two Year Blog Anniversary of btctrading.com!
It is really hard to believe that two years have already gone by from the very first post that was published back in 2011 and 147 posts later, here we are with more then 115k hits,not bad for a free blog i’ve started just for fun.  I value the time you take to stop your daily tasks to read my posts and leave your wonderful comments. Your input brings so much value to this blog, more than you know.

I’d like to share with all of you a view of monthly visits:

Untitled-1

It is interesting to see some relationship with market behaviour, every top in monthly accesses has been followed by a top in the market, except the August 2012 top were the number of accesses was less but a slight top it is still noticeable. I think that a top is in with the last 266$ seen in April but this doesn’t mean that the market is bearish, i think it is consolidating above 100$ and preparing for the next move.

Happy Blog Anniversary – Thank you for your support and see you at the next update!

Long Term Update: Head and Shoulders

UploadImageThe head and shoulder pattern is one of the most common reversal formation, while it is preferable that the left and right shoulders be symmetrical, it is not an absolute requirement, in fact the slope of the neckline (pointed out in the attached left chart, click to enlarge it)  will affect the pattern’s degree of bearishness; a downward slope is more bearish than an upward slope, in this particular case the slope is telling us that it’s not much bearish and indeed the market bottomed out at 79$ near the level that i indicated as a potential support in one of my previous update and exactly at the long term VWAP (computed using last 3 months of data) without a severe crash under 50$.
This pattern helped me in the decision to close my long term trade 5 days ago at 128$.

Looking the big picture i think that this market it’s still bullish in the long term as long as it stays above 80$, another bullish indication is that the recent bottom has been higher then the double bottom made in April, now BTC/USD is approaching the first deviation line at about 130$ and it’s crucial to go above it with a good volume breakout. A failure to conquer the 130$ level would be a first warning of a downside move, probably headed below the recent 79$ bottom.