I consider parabolic fitting a smoothing algorithm with poor forecasting results in most cases, but apart from theoretical considerations let see in detail if parabolic smoothing and forecasting can help us finding a strong long term resistance for BTC/USD.
Parabolic rise is also called an accelerated growth phase, so after it breaks out from a long basing pattern (for bitcoin the 16 months prior January 2013), it starts a rapid growth phase with a series of ever-steepening, rising trend lines. The acceleration of bitcoin price appears as a parabolic curve on the price chart, and can happen that the final stage of the move will end with a leg that is virtually straight up with a buying climax last bar.
Parabolics almost always collapse, this is what worries me at the moment, sometimes there is a bit of topping followed by a precipitous decline, but other times the straight up move reverses into a straight down move of equal or greater magnitude.
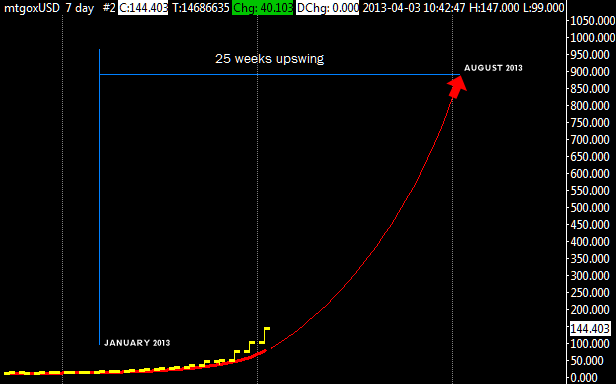
What is doing now bitcoin is a good example of a parabolic rise in an early stage, using last 10 weeks i derived the formula of the current parabolic that bitcoin is following:
y = 1.81 * x2 – 11* x + 35 where x2 is x to the power of 2
As i explained many times i think that normally a swing can last up to 25-30 bars, in this case weeks, extrapolating the above formula i can compute a target (you can do the same just substitute “x” with the number of weeks).
With 25 weeks i’ve a target of 890$, using 20 weeks i’ve a reasonable 540$ target; i think that a long term top beetween 500$ and 1000$ is likely to happen, all depends if bitcoin will reach the wall street crooks or not:)

Jokes apart, if this weekly upswing will last 25 bars then the top is due next August/September 2013.