Short Term Update: daily view MtGox

chart
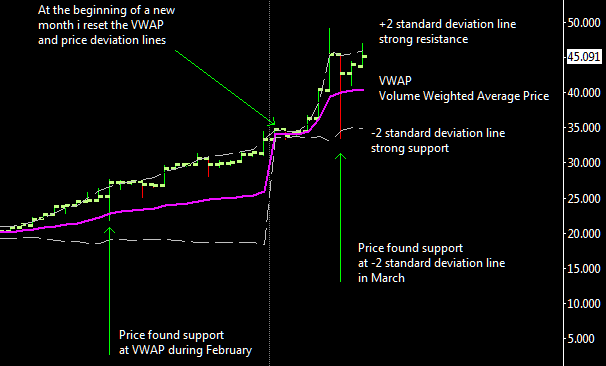
This is a daily view since mid February, 2013.

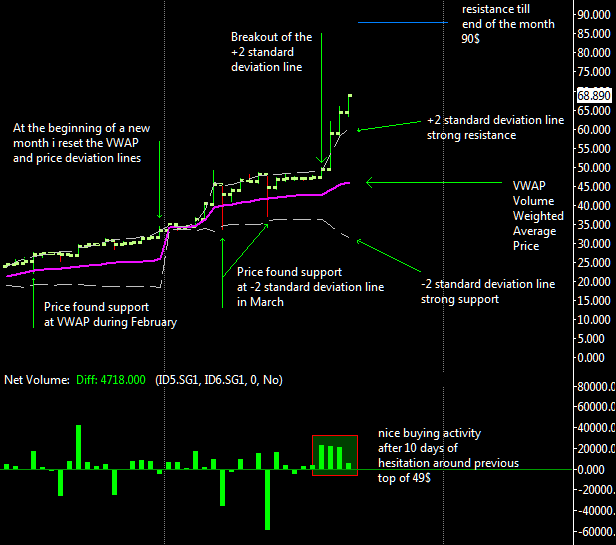
It is clearly visible how  much strength there is in this uptrend, in the second pane of the chart there is the net volume and i report  a nice buying activity after the breakout of the old resistance at 49$, buyers are predominant at all time high and again this is very bullish; usually before any explosive price breakout to the upside there is a period of consolidation and it’s exactly visible on the chart in the 10 days from 7 to 17 March.

The VWAP is the main support level and now it’s at 46$ for this month, the price breakout above 49$ broke the second standard deviation line confirming the nature of the move as an explosive breakout, the target for this month is now at 90$ and i computed it as usual using actual volatility that is 70% higher compared to the level seen in June 2011 top, absolutely remarkable.

For the bears, if there are any outside there:), the first bearish sign is a drop under 54$ then the penetration of the vwap under 46$ should confirm a reverse in the trend.


Again on VWAP

chartIn the last days we have seen an extremely volatile market, with the yo-yo behaviour of the last thursday, it is easy for an amateur speculator to get slammed during a 33% correction. In this situation a better approach is to try to figure out whether current prices are high or low relative to a normal price range. If you can do this you can begin to trade any market with confidence and VWAP is a powerful tool do to this.

I do that, thanks to Sierrachart vwap add-on, computing support and resistance with an estimation of current volatily and the time considered for the forecast (cumulative since day 1 of each month as illustrated in the above chart). So if the market goes under the -1 or -2 standard deviation line support and then you have a buy signal you may try to “take a stand” or basically telling everyone that you think the market is under priced and telling to other market partecipants that they might have made a mistake by pushing the market too low. It is visible in the attached chart how VWAP give support if volatility is not extreme and if so market can find support at the -2 standard deviation line as happened 3 days ago.

On a weekly basis, the trend is still up, trading activity is growing and show an increasing volume activity. The weekly moving average is unaffected by the recent wild daily swings, only if price stays below the VWAP for many days drifting lower and under 35$ then i can conclude that the long term trend reversed to the downside with a  downtrending VWAP line.

For who use Sierrachart  to follow MtGox with slush plugin, i’d to inform you that now is possible to follow also MPEX stocks with real time quotes with a plugin licensed by kakobrekla, you can contact him at bitcoin assets irc channel for more detail, IRC handle is kakobrekla