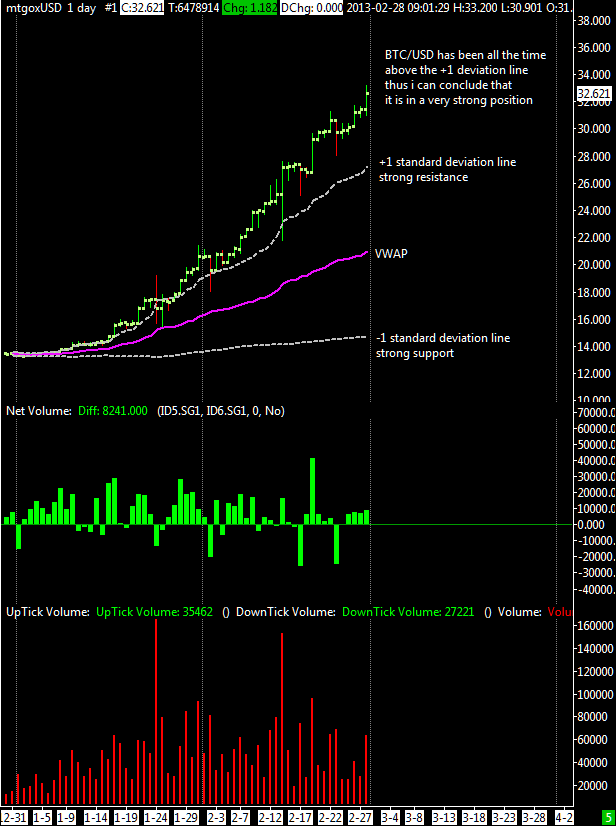
This is a short term view of last 2 months when this market started to rise from 13$. On the chart i’ve attached the VWAP or Volume Weighted Average Price. VWAP is equal to the sum of the volume of every transaction multiplied by the price of every transaction divided by the total volume for the trading day.
The theory is that if the price of a buy trade is lower than the VWAP, it is a good trade. The opposite is true if the price is higher than the VWAP. But, because of the great strength of BTC/USD, in the last 2 months rally the price has been always above the VWAP so it’s hard to say now if it is a smart move to sell. I’ve added on the chart also 2 standard deviation lines (+1 and -1) , the standard deviation is computed using differences from close and vwap.
Btc/usd at the moment is drifting up following the +2 deviation line (not plotted in the attached chart) and it is very bullish. A good entry point could be a drop to the +1 deviation line at ~27$.
Understanding how price interacts with the VWAP price and its standard deviations dramatically fine tune both entries and exits and gives you a professional edge.
Here’s another example with an intraday chart of today:

Chart starts at midnight of 28 February GMT time. As you can see the deviation lines provided both support and resistance giving you an edge on where to place your entry and exit point. Note how the price interacts and extends beyond the VWAP testing the 1st upper standard deviation. Next deviation line is at 33.8$ for today. For who want to give it a try, hit F6 on a sierrachart chart and select the indicator named “Volume Weighted Average Price” from the “Studies Available” list on the left. On the same window, on the right, there is the “Studies on the Graph” list where you can select the added VWAP and customize options. For intraday i recommend to set the VWAP options to:
-
Input data = last price -
Time Period Type = days
-
Time period length = 1
-
Distance Multiplier = 1 (or 2,3,4 to see bigger deviation lines)
-
Continous non resetting std.deviation line = no
-
Continous non resetting mode = no
-
Base on underlying data = yes
-
use fixed offset instead of std.deviation = no