Quick Short Term Update: MtGox Daily Chart

We have just seen a 2 day break and the question is whether or not it is just the first stage of something bigger; i’ve the answer and the answer is no, i think bitcoin will hold the 15$ level, 15.4$ was also the old August 2012 top and i think that now this level defines a price support area. I don’t expect a bearish development after the prolonged period of accumulation spent at 13$ that fueled the rally up to 19$, and as long as it stays above 15$ level it will have an upside potential the bitcoin/usd currency pair.

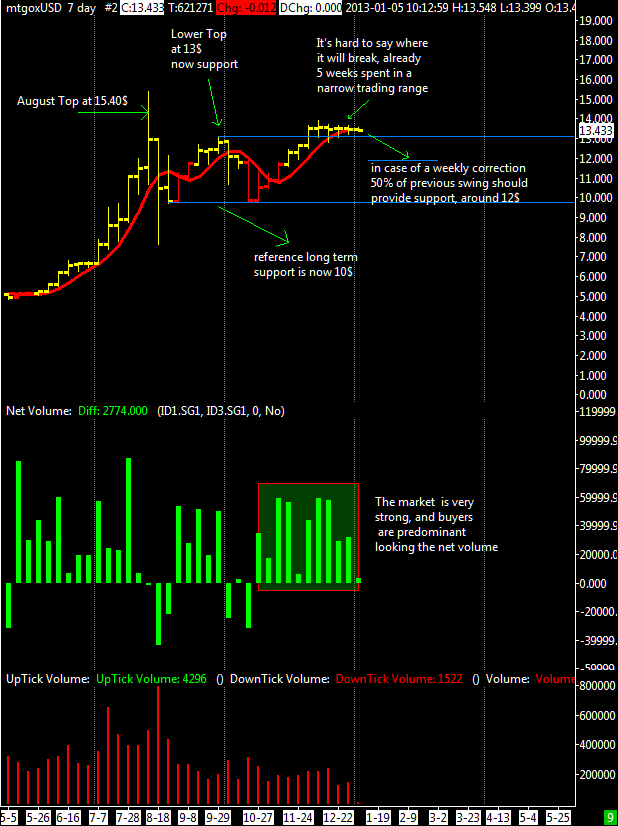
To conclude looking the net volume i haven’t seen a big aggressive selling activity during the sell-off, buyers supported very well the drop and i interpret this as bullish behaviour.

chart


Long Term Update: Weekly View at MtGox

chartThis is a weekly view since may 2012. It is visible the August top at 15.40$ and the double bottom at ~9.70$, in the second pane of the chart there is the net volume and it’s clearly visible the strength of the current solid uptrend, buyers are predominant even in the last 4 weeks of congestion spent at around 13.3$.

I include as usual in this first post of the year a forecast for the 2013, considering actual volatility it will be very hard for BTC/USD to go above 18.7$ before the end of 2013; at the same time bitcoin shouldn’t go under 9.6$ (that correspond also to the recent double bottom).

A confirmed drop under 9.6$ is without any doubt a strong bearish sign; by the way the market seems to be holding well at the moment and stable above 10$.  In case of a correction in the weeks to come, just looking at the chart and applying the principle that higher highs typically follow higher lows i can project one obvious downside target for the BTC/USD and it is located around 12$, above previous 9.7$ mid-term low and it represents also a 50% price retracement support.