Long Term Update

This is a template i use with metatrader 4 where you can see a price regression channel. Yellow line is the same average i use on sierrachart, ALMA moving average.

weekly
Weekly Chart since October 2013

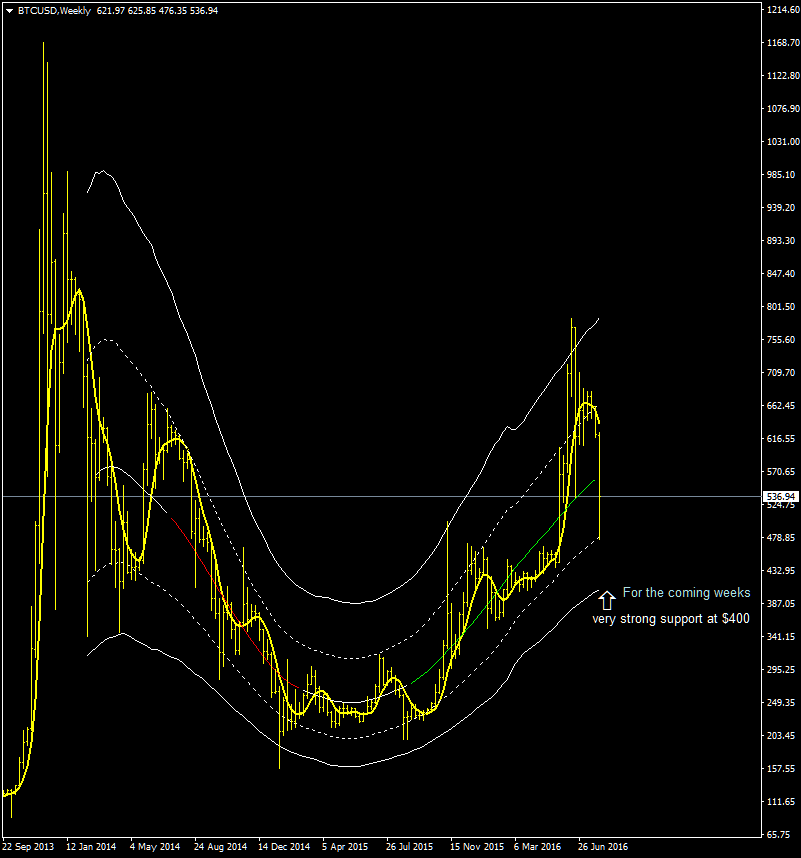
The dotted deviation lines are calculated using the volatility derived from the average true range indicator. The solid deviation lines are calculated with the same approach but using two times the value of the average true range. Most of the time XBTUSD stays inside the dotted deviation lines but during period of high volatility it moves towards the solid deviation lines as happened in the last Top of June at $780.

With the bitfinex flash crash XBTUSD tested the first lower deviation line at $475 although on some exchanges the bottom touched $460. I don’t think is over yet, there might be a secondary reaction that can last all this month and maybe part of September with a test of the lower deviation line, this price level is near $400 as indicated in the chart.

The color of the mid-channel line represents the strength of the trend, red if bearish, white for neutral and green if bullish, at the moment the main trend is bullish and it’ll not change if XBTUSD doesn’t move below $400 for a prolonged period of time. I’m not going to liquidate my position as soon XBTUSD stays inside this long term bullish price channel.

As usual this article is available also at steemit.

Weekly Range Update

XBTUSD daily Chart with support resistance levels

XBT / USD weekly range $605-$ 660 | ALMA daily moving average is bearish and the main resistance is the VWAP at about $ 660, first support at $605.

XBTUSD broke previous week support and is now in a weak position under $ 660 US dollars. The resistance zone is $ 660-710, I think that XBTUSD will remain below $ 660 this week with a second resistance at about $ 710. The volatility finally increased with a drop in the last weekend.

The weekly forecast remains bearish, I think we will continue to see the bitcoin below the VWAP at $ 660.

The only positive note is the RSI oscillator that entered in oversold territory after a while and could allow a bitcoin rebound in the next few days, rebound which should end at the VWAP ($ 660).


  • Italian version here at Bitchanger
  • I’m posting also at steemit, if you want to follow me there and upvote my posts click here.

Weekly Range Update

eng
XBTUSD daily chart

XBT / USD weekly range $ 640- $ 710 | ALMA daily moving average is slightly bearish and the main support is the VWAP at about $ 640. XBTUSD remains in bullish position always above the VWAP since June 24, last week it tested $640 and reacted from there but generally speaking we are in a flat congestion between 630 and 680 dollars, for short-term traders i recommend to trade this price range accordingly (between the two extreme of 570 and 780 US dollars).

The resistance zone is $ 710-780, I think that XBTUSD will remain above $ 640 again this week with a first resistance at around $ 680. The volatility continues to be very low and this will have to be solved sooner or later with a breakout above or below the price range defined by the deviation of the VWAP lines indicated in the graph. The weekly forecast remains unchanged, I think we will continue to see the bitcoin confined in this price range, between 640 and 710 US dollars.

The RSI oscillator remains in a neutral position around 50 although is slowly orienting for an upward movement.

Weekly Range Update

XBTUSD daily chart
XBTUSD daily chart

XBT / USD weekly range $ 635- $ 710 | ALMA daily moving average rose upward and the main support is the VWAP at about $ 635. XBTUSD resists above the VWAP for almost a month. The resistance price zone is $ 710-800, I think that XBTUSD will remain above $ 635 also this week with a first support at around $ 670, which corresponds to the ALMA moving average I use. It remains to be seen if market participants will manage to push the bitcoin price over the resistance at $ 710, the volatility after a period of contraction increased again and it did it by pushing up prices rather than downward, a positive note that leaves some hope for a break above $ 710.

The RSI oscillator remains in neutral position around 50, yet there seems to be a trend strong enough to move above $ 710, at least this week.

Mid-Week Range Update

imageXBT/USD range till sunday $625-$740 | daily moving average is bulllish but slowing down and main support is at VWAP near $625 , i expect less volatility these days while the halving is coming next saturday. Eventually sunday after the halving the market might spike up to the resistance price zone 740-800 usd.

RSI oscillator average is near oversold territory and reversing to the upside, i don’t expect this market to move below $620.

Weekly Range Update

XBTUSD Daily Chart Bitfinex

XBT/USD weekly range.forecast $610-$735 | daily moving average is bearish and main support is at VWAP near $610. XBTUSD is resisting above the VWAP after a quick test below the support i mentioned in the previous update around $585, support broken but quickly regained.

Resistance price zone is $735-860, i think that XBTUSD should remain above $610 but if it starts to spend too much time below it then i think that a new low is ahead in the support price zone $485-$610 with the RSI oscillator that which will probably become oversold by then.

Italian version here at Bitchanger

Short Term Update

imageThe updated chart shows how the VWAP dynamic support (calculated with two months of data) coincides with an old resistance now turned support. I think this will be a key support to be observed in the coming days and will tell us if the bullish move has finished or not.

Because of high volatility the support area is big and XBTUSD is right in the middle, RSI is giving a sell signal this doesn’t mean a drop instead XBTUSD might go lateral for few weeks before resuming the uptrend. Any weakness below $580 would be interpreted as a definitive end of the current big upswing.

Italian version here at bitchanger.

Weekly Range Update

2201XBT/USD weekly range.forecast $725-$870 | daily moving average is bulllish and main support is at VWAP near $580. XBTUSD continues to stay all the time above the first positive deviation line of the VWAP, a bullish behaviour.

In case of a strong price correction i’m looking at the $580 support as an interesting buying zone where to further increase my long-term position; position with a size of 3 units (150 btc) at an average price of $549.

Italian version of this update here at Bitchanger.

Weekly Range Update

weekly range en
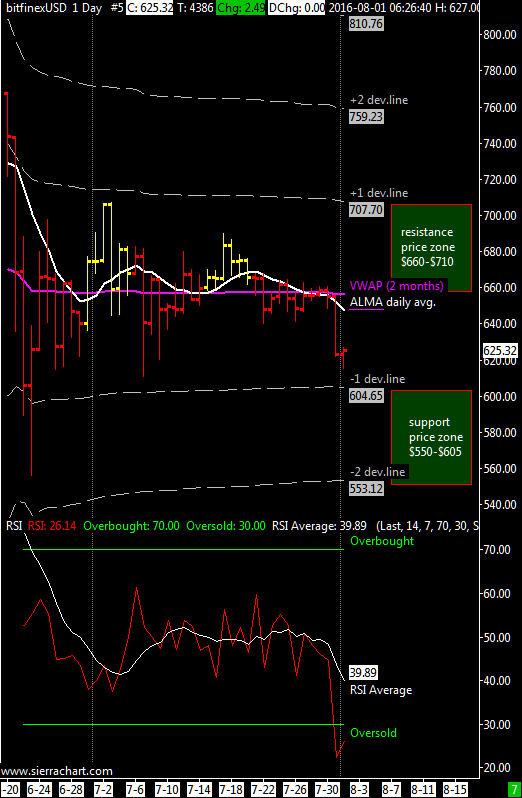
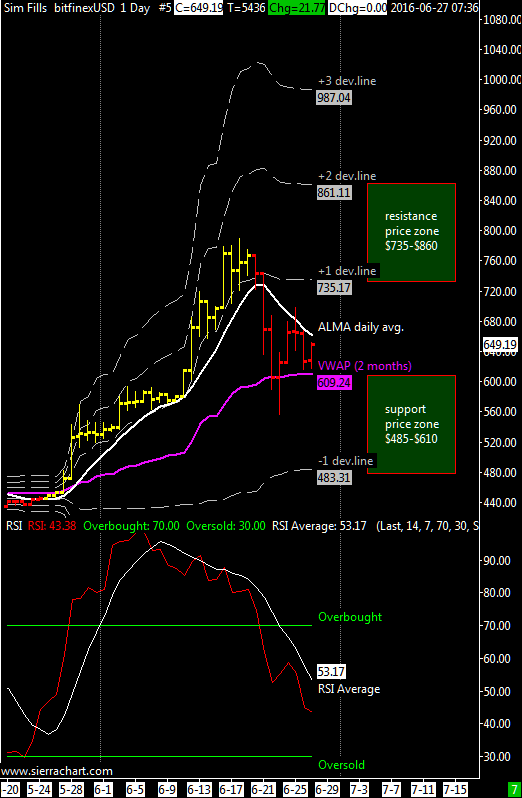
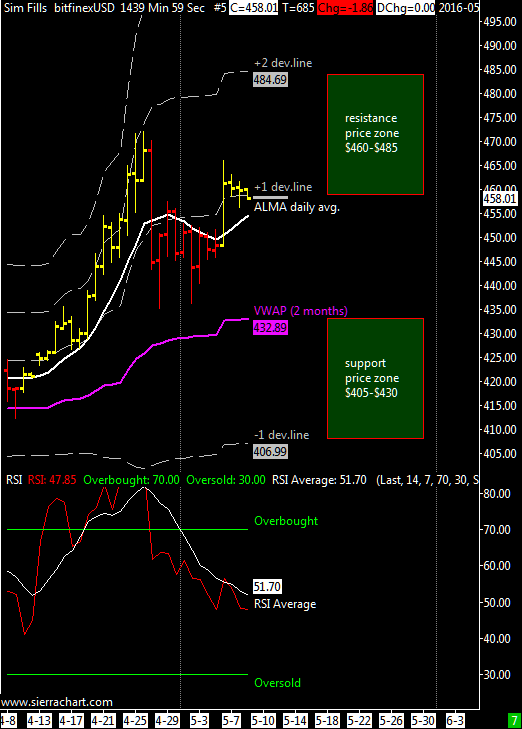
XBT/USD weekly range.forecast $610-$800 | daily moving average is firmly bulllish and main support is at VWAP near $520 although when the market is strong usually the first positive deviation line act as main support; now at $615.

In my previous weekly range update i was thinking that XBTUSD was going to add another 50$-60$  in the current up-cycle and it happened. Right now i’m observing market behaviour around the static resistance of $680, apparently XBTUSD is going to break this resistance and skip the scenario of a substantial price correction.

Aniway in case of a strong price correction i’m looking at the $520 support as an interesting buying zone where to buy the dip.

ITALIAN VERSION OF THIS ARTICLE HERE AT BITCHANGER.COM

Long Term update: Static Resistance

Monthly Chart

monthly

This is a simple monthly chart since Jan.2012, important facts are:

  • Accumulation zone #2 is above previous one, #1 in the chart
  • The static resistance at $680 is also the 50% of the price swing from the all time high down to the 2015 bottom at ~$150

As i explained in past updates the midpoint or 50% it is one of the strongest and most important resistance/support level. The main trend is obviously up (at least so far) because the low around point 2 in the chart is above point 1 thus is legit to expect a new all time high if this market can break above the $680 static resistance.

Furthermore the fact that the two accumulation zones highlighted in the chart never overlap tell us that the underline long term trend is very strong and because of this i expect a new all time high in case of a strong breakout above $680.

Forecasting resistances

btcusd-mn1-simplefx-ltd

This is a template i use for long term analysis with metatrader 4 platform, first i compute a price regression with 12 or 24 bars/months with a monthly chart then i compute supports and resistances. Dotted lines represents supports/resistances using the recent volatility of XBTUSD, non-dotted lines are levels computed using twice the value of recent bitcoin volatility.

We are exactly at the resistance and this is very interesting because in 1-2 months we will see if bitcoin long term trend is still up or not.

I have taken in account the log-normal distribution of price otherwise i’d have had very bad results in computing the levels, usually it is not required but when prices movements are so high you have to. What does it mean? It’s simple, before doing any calculation first compute the natural log of the price, do your stuff and last reexponentiate the data to have back the price chart with a linear scale.
This is why i do not recommend to use standard bollinger bands with bitcoin on a long term chart, you would have bad results, sometimes with the lower bollinger band going negative! clearly unrealistic.


Weekly Range Update

XBT/USD weekly range.forecast $435-$460 | daily moving average is bullish after the upmove of May 6. Strong support is always at $435 near the short term VWAP and there is also a recent double bottom. In case of another upmove strong resistance is at $485.

image

With my metatrader 4 price regression channels i’ve a similar picture with support at $424-435 and resistance at $463-475 price zones. Yellow line is the same average i use on sierrachart, ALMA moving average.

BTCUSDDaily