Weekly Range Update

eng
Daily Chart XBTUSD

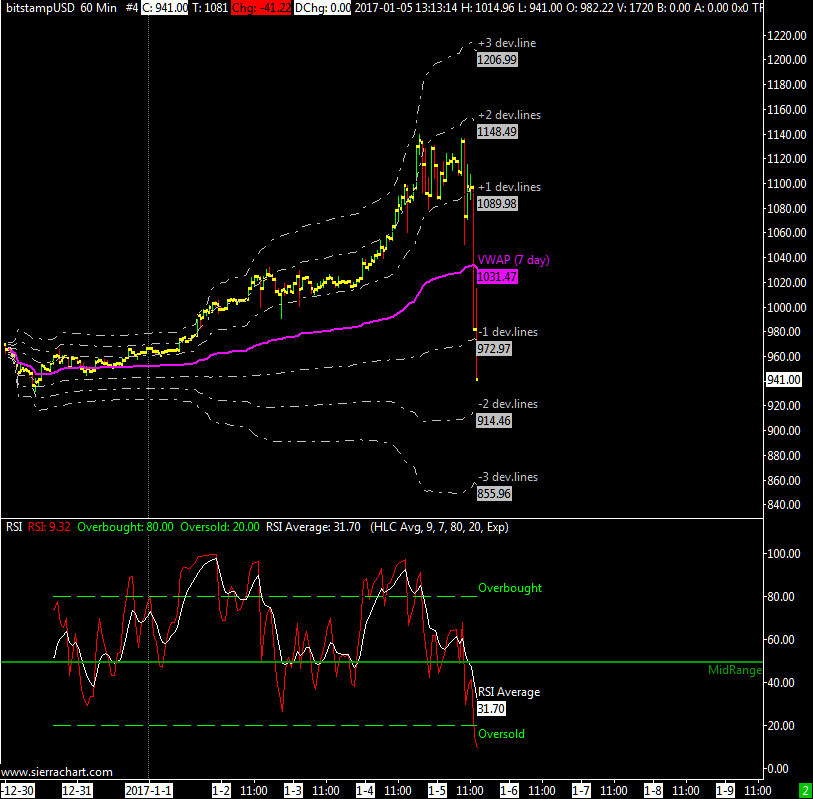
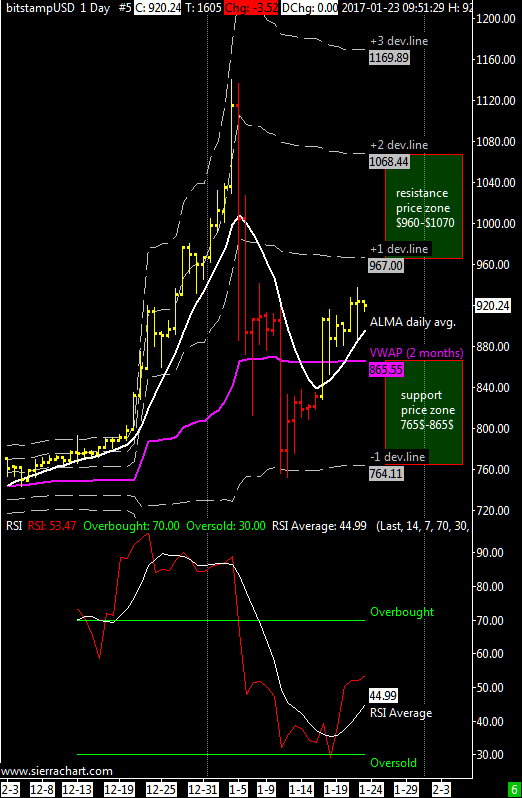
XBT / USD weekly price range is 865$-965$ | The XBTUSD cross has moved above the VWAP regaining a position of strength, for this week the main resistance is the price zone between the first and the second deviation line or the 965$-1070$ price range; This technical rebound should stop in this price range (970$-1070$ ) now we need to wait to see where will be done the next relative maximum to understand how it is positioned in the medium term, given the situation of the weekly chart I expect that the next top will be lower then the other one of 3 January done approx at 1170$.

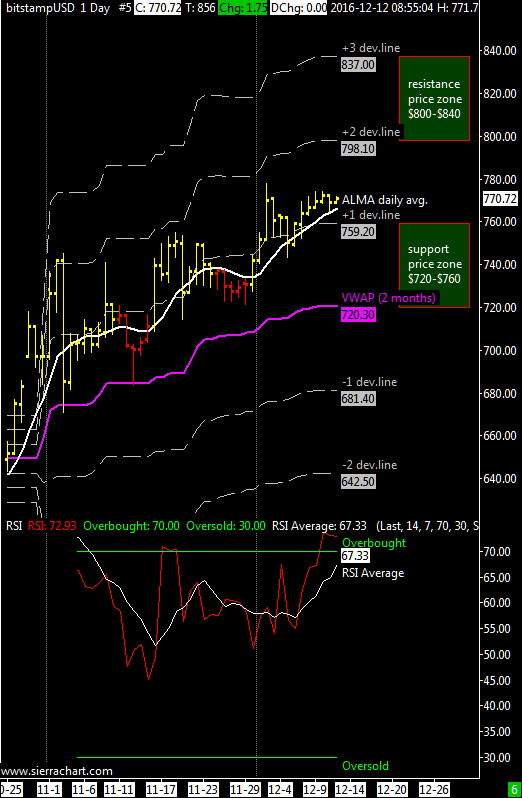
As support it is valid the first negative deviation line VWAP at around $ 765 although I feel that the last minimum done at $750 is confirmed and i think to be right considering now the VWAP at 865$ as main support for this week and probably the next one.

The daily RSI oscillator average has reversed to the upside but without going into oversold first, thus great buying opportunities have not yet been materialized.

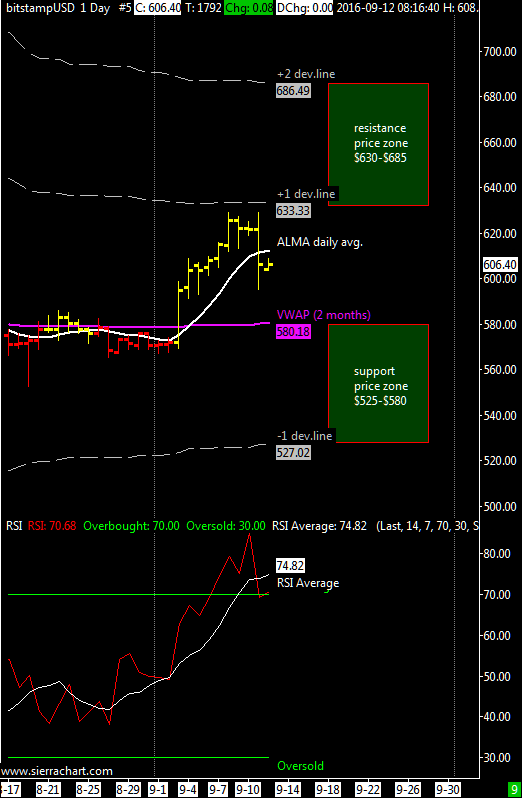
In cases of extreme fall the support area run from 590 to 680 USD.

ITA version here at bitchanger.com

Weekly Range Update

eng
Daily Chart XBTUSD

XBT / USD weekly price range of $820-$960 | The main resistance is the third price deviation line above the VWAP at $ 960 which also corresponds to an important resistance on the weekly chart that I showed in the previous update; the main support is the VWAP at approximately $750 even though I think it should work the first positive deviation line above the VWAP at $820. This week we’ll see if there will be enough strength to make a new high at $960 to conclude the year in the best possible way.

The average daily RSI oscillator is in overbought zone. The RSI on the weekly chart is also overbought and reached the value of 79, at this point there is a realistic chance that on the weekly chart a top is forming.

In case of extreme drop the support is the price area between 530 and $ 620 US.

Italian update here at bitchanger.com

Weekly Top Estimate

weekly
In the previous update of 18 November I wrote that I would have expected a weekly Top in the price area between 770 and 910 US dollars. This week the cross xbtusd did a strong acceleration with an up movement of more than $ 80; these large movements concentrated in a single week can move the price regression channel that i use with MetaTrader 4, especially if they happen in a single price bar. The indicator adapts to new information that comes in projecting new supports and resistances levels with the effort to obtain a better fit of what is happening.

The new resistance zone ranges from $820 to $970 but you have to consider that if this week bitcoin price will continue to rise with this strength even this new resistance area will change again.

For those who are anxious to take profit or go short I strongly suggest to wait and see where this currency pair will form the next congestion zone on the daily chart.

For my italian followers here’s the italian version at bitchanger.com

Weekly Range Update

engXBT / USD weekly price range forecast $760-$800 | Even this week the support/resistance levels remain the same, the main resistance is the second dev. line above the VWAP at $800 while the support is still valid the VWAP at $720 approximately but with these levels of low volatility i think it will be support the first dev.line above the VWAP at $760. This week we’ll see if there will be enough energy to break the $800 and reach the next resistance at $840 by year-end.

The average of the daily RSI oscillator is in overbought territory. The RSI on the weekly chart is slighty overbought just above the threshold of 70, despite being overbought for some continuous weeks i think that a maximum on the weekly chart has not yet been done.

In case of extreme drop the support is the price area between 495 and 590 US.

Italian version here at bitchanger.com

Weekly Range Update

Daily Chart XBTUSD
XBTUSD daily Chart

XBT / USD weekly price range is $720-$800 | Nothing new also for this week with the main resistance ($ 800) at the second deviation line above the VWAP while the support is the VWAP at about $ 720. As long as the bitcoin will maintain this upward tendency with reduced volatility the levels of support and resistance will not change much, going hand in hand with the advance of the price.

The average daily RSI oscillator is entering the overbought zone. The RSI on the weekly chart is in overbought and above the threshold of 70; despite being overbought for some weeks I think that a maximum on the weekly chart has not yet been done.

In case of extreme drop the support is the price area between 485 and $ 575 US.

XBTUSD alternative template

Let’see now the daily chart template I use with Metatrader 4. As you can see the price levels are similar to VWAP and its deviation lines. At the moment the price is consolidating above the median line of the price regression channel preparing for a move up to $810 in accordance with the $800 resistance provided by the second deflection line of the VWAP. The area around 720-730 dollars will provide support in case of correction.

Italian version here at bitchanger.

Weekly Range Update

XbtUsd daily chart
XbtUsd daily chart

XBT / USD weekly price range of $690-$785 | ALMA daily moving average is slightly bearish, for this week the main resistance is the second price deviation line above the VWAP at $785 while the support I believe it is valid the VWAP itself at about $ 690.

The average daily RSI oscillator is not giving significant indications, it continues to remain above the mid point of 50. The RSI on the weekly chart is overbought but is just above the threshold of 70, it may still report the formation of a Top not having the bitcoin still broke decisively the $750 resistance.

In cases of extreme drop support is the price zone between $465 and $550.

Italian version here at bitchanger.

Weekly Range Update

eng
Daily Chart XBTUSD @bitstamp

XBT / USD weekly range $598 – $634 | ALMA daily moving average is bullish and the main resistance is the second price deviation line above the VWAP @$630 while the support is always the VWAP @$570 although i think it will remain above 595$ also this week.

A rise above $630 is close for the same reason i told you severa times in the past weeks, XBTUSD is slowly accumulating and the weekly ALMA moving average already turned up but its slope is very low for now, in the upcoming weeks there should be a final breakout above $630.

The RSI oscillator has moved to an equilibrium point around 50 and there is enough room for more upside movement till the overbought zone.

In the event of a sharp fall, as said many times is always very valuable the support around $420.

Italian version here at Bitchanger.com

Weekly Range Update

eng
Daily Chart XBTUSD @Bitstamp

XBT/USD weekly range $ 580-$ 630 | ALMA daily moving average is going flat after many days of good advance and the main resistance is now the first positive deviation line of the VWAP at around $ 630.

I think the cross XBTUSD will remain below $ 630 this week with a second resistance at about $ 680. The weekly ALMA moving average is apparently turning up but i don’t expect a break above $630 because also of an high reading of the RSI oscillator that is in overbought territory above the 70 threshold value..

I said in many previous updates that in case of a volatility spike due to another price crash the deal is to buy slightly above $420.

Italian version here at bitchanger.com

Weekly Range Update


eng
Daily Chart @bitstamp

XBT/USD weekly range $ 550-$ 615 | ALMA daily moving average is still slightly bearish and the main resistance is unchanged at VWAP around $ 615.

I think the cross XBTUSD will remain below $ 615 this week with a second resistance at about $ 680. The weekly forecast is slighlt bearish but i don’t expect a break below $550 because of low volatility.

In case of a volatility spike due to another price crash the deal is to buy slightly above $420.

Weekly Range Update

xbtusd daily chart @bistamp

XBT/USD weekly range $ 550-$ 620 | ALMA daily moving average is slightly bearish and the main resistance for now is always the VWAP at $ 620.

I think the cross XBTUSD will remain below $ 620 this week with a second resistance at about $ 690. Volatility has stabilized. The weekly forecast is flat, i don’t expect a break above $620 or below $550.

The average of the RSI  oscillator turned upward and is giving some bullish indications but only a breakout above $ 620 would confirm a bullish scenario.

This article at steemit
Italian version at bitchanger.com

Weekly Range Update

eng
XBTUSD @bitstamp

XBT / USD weekly range $ 495- $ 640 | ALMA daily moving average is still bearish and the main resistance is the VWAP which adjusted to about $ 640 after the flash crash caused by Bitfinex.

I think the cross XBTUSD will remain below $ 640 this week with a second resistance at about $ 715. Volatility after the peak of last week is now stabilizing. The weekly forecast remains bearish, I think we will continue to see the bitcoin below the VWAP to $ 640. The actual price rebound could already be exhausted, if so then i expect a retest of the $565 price level.

The average of RSI oscillator is turning upward but has not yet given a bullish signal, it is at 26 and below the threshold of 30 that identifies the oversold zone.

Because of bitfinex exchange going offline i’m moving back to using bitstamp data.

This article at steemit
Italian version at bitchanger.com