Long Term Update: Volume Analisys at Kraken/Bitstamp Part II

Old post is here

The trading platform used here is unchanged: Sierrachart 64 bit.
The big amount of tick data processed to compute this interesting volume oscillator wouldn’t be possible to do at TradingView or similar online platforms.
The “up/down Volume Ratio” oscillator is computed and smoothed using a 18 periods (18 months or 1 year and a half) linear regression moving average.
Volume made on an uptick is considered positive while if made on a downtick is negative, then the aforementioned oscillator is applied.
I added also in the chart the widely know ALMA moving average (9 periods, standard settings).

I added for comparison the same template applied to BTCUSD at Bitstamp exchange.

Volume Ratio Oscillator Kraken/Bitstamp Comparison (click to enlarge)

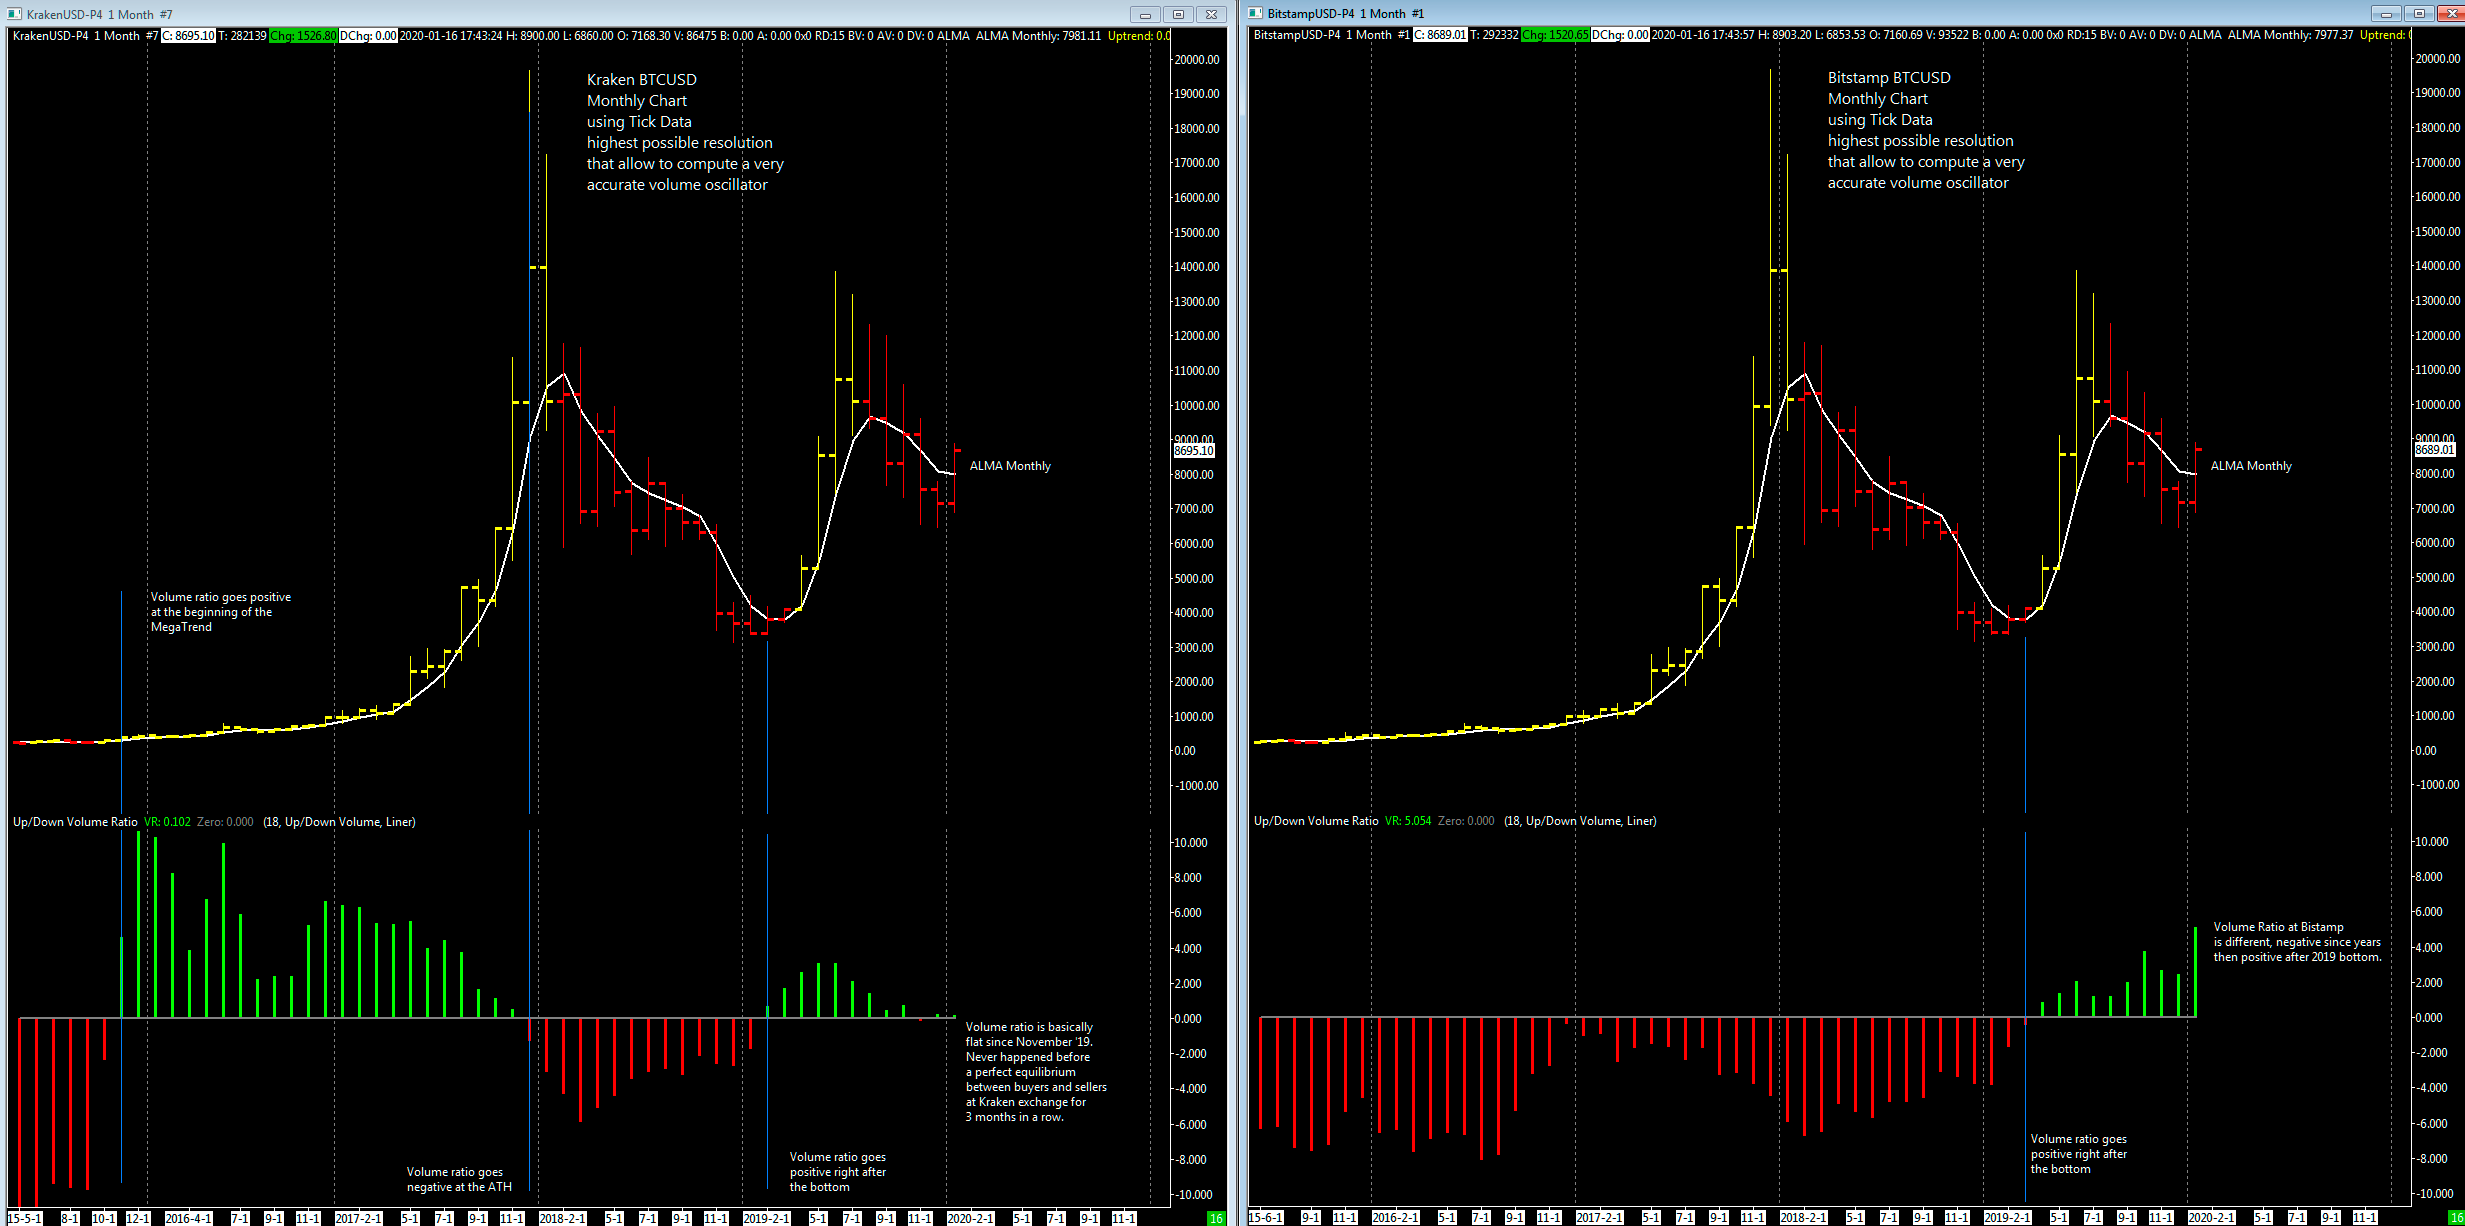
Very curious to see a perfectly balanced volume activity at Kraken exchange for 3 months in a row while at the Bitstamp the volume activity is unbalanced upwards.
As a positive note i can say that i don’t see any negative volume activity in either of the two exchanges considered. Said this my best guess is that the price retracement from about $13800 to $6400 was a normal correction of a bullish market and that the bear market ended on March ’19.


Weekly Top Estimate

weekly
In the previous update of 18 November I wrote that I would have expected a weekly Top in the price area between 770 and 910 US dollars. This week the cross xbtusd did a strong acceleration with an up movement of more than $ 80; these large movements concentrated in a single week can move the price regression channel that i use with MetaTrader 4, especially if they happen in a single price bar. The indicator adapts to new information that comes in projecting new supports and resistances levels with the effort to obtain a better fit of what is happening.

The new resistance zone ranges from $820 to $970 but you have to consider that if this week bitcoin price will continue to rise with this strength even this new resistance area will change again.

For those who are anxious to take profit or go short I strongly suggest to wait and see where this currency pair will form the next congestion zone on the daily chart.

For my italian followers here’s the italian version at bitchanger.com

Weekly Top Estimate

Weekly Top Forecast
Weekly Top Forecast

XBTUSD cross has finally break through the first resistance above the mid-line of the price channel now at $640, same price level of the 2 month VWAP. In the attached chart I highlighted the price zone where I expect the next top will fall.

I believe that the next top will fall in this price zone, precisely between 770 and 910 US dollars; because of the long-term trend still up i think that bitcoin could make a maximum higher than the previous one of June, it is not excluded a Top around $ 900 as shown in the weekly chart.

What if i’m Wrong

It exists the possibility that i’m wrong if the dominant timeframe isn’t the weekly.
So what? Well we can switch to another timeframe for example the monthly chart. Here the price channel is much wider then the weekly chart, midpoint is at around $500 usd and the two positive deviation lines are at 870 and 1500 usd. Again we have a resistance similar to the weekly chart, around 870-900.

In order to prove that my weekly scenaro is wrong XBTUSD have to break above 900 usd with strong volume, as you know a High-Volume Breakout signal a move higher possibly to $1000 and beyond.