Weekly Range Update

XBTUSD dailychart
XBTUSD dailychart

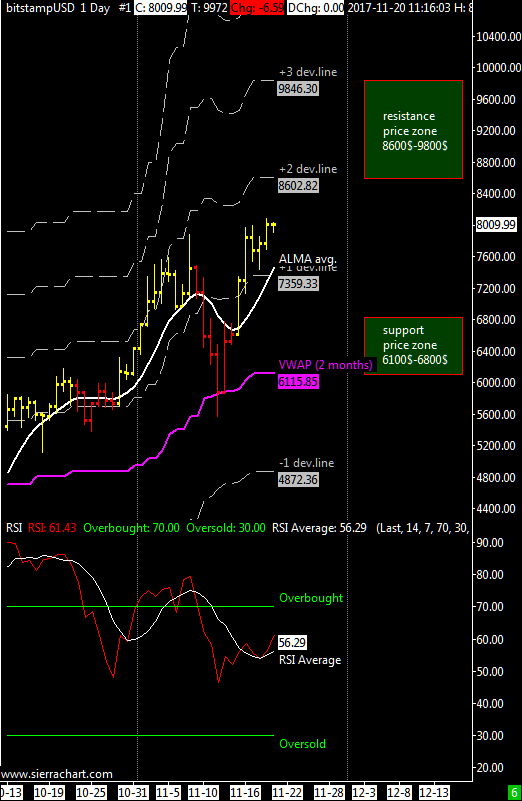
XBT/USD weekly price range 6800$-8600$ | This week the 2-month VWAP updates to 6100$ from last week’s 4800$; new data is replacing the old ones and it may happen that you have some slight changes on the price level of the reference average.

The resistance zone ranges from 8600$ to 9800$ and is defined by the 2nd and 3rd deviation line of the 2-month VWAP.

The support area ranges from $6100 to $6800 and is defined by VWAP and an intermediate level between the VWAP and the 1st deviation line.

I think it is very difficult to see a test down to the VWAP at $6100, if there were to be some profit taking the market should not fall below $6800, considering that the RSI oscillator turned upside without testing the oversold area i still believe that this market will go over 8000$ eventually after a small correction towards our first support at 6800$.

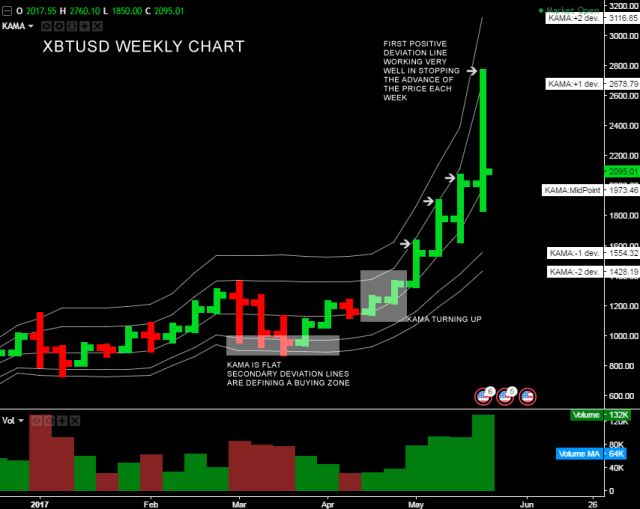
The other template I use on Tradingview with KAMA average and deviation levels is very similar to this one; the weekly KAMA is at 5800$ not far from the 6100$ of the 2-month VWAP.
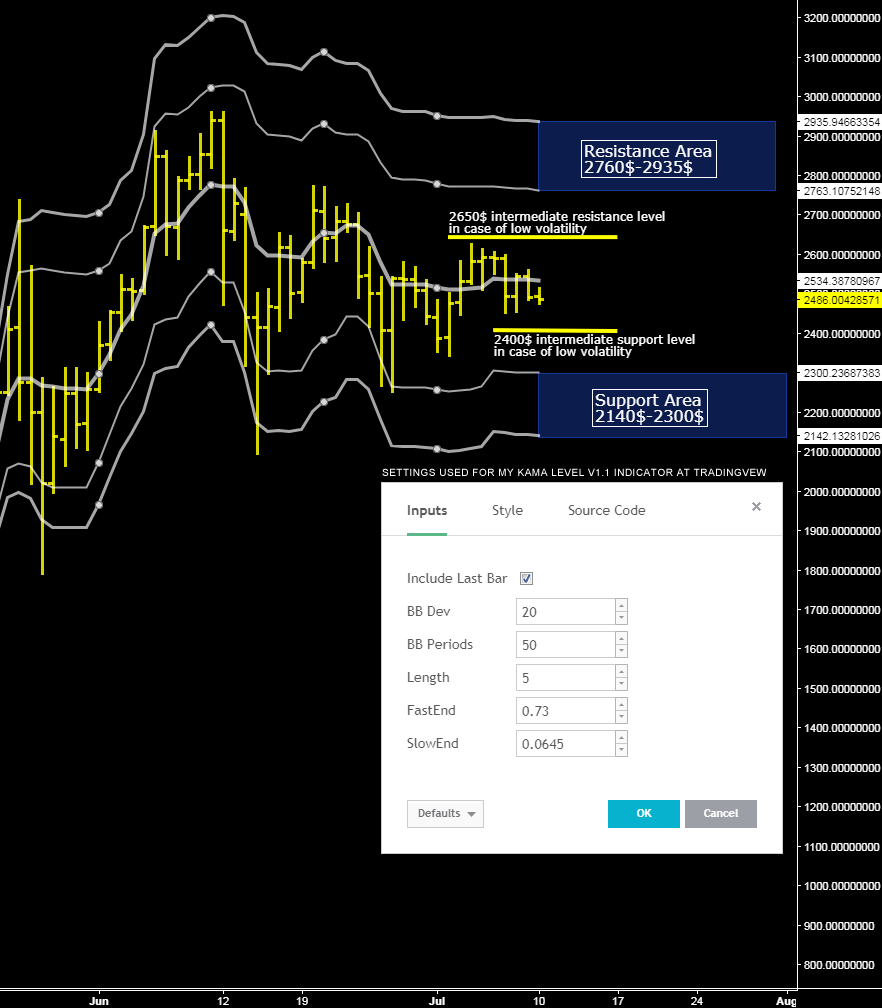
The resistance zone is 8000$-9300$, slightly lower than the one presented with this update of 8600$-9800$.
Basically we have a decent correlation between the two templates (VWAP using Sierrachart and KAMA using Tradingview. com)

In the event of an unexpected catastrophic news, the support area on the weekly chart is updated to 3200-4000 USD.

ITA Version Here.

Weekly Range Update: Kama Levels

Kama Levels BTCUSD Composite Index

For this week I will use my KAMA indicator with deviation levels available on the TradingView platform for free, the weekly price range in case of low volatility could be 2400$-2650$, in case of normal volatility the expected range is 2300$-2760$.

In the attached chart, the XBTUSD composite index is used and it has been derived using the price data of seven bitcoin exchanges. The formula to use is as follows:

(Poloniex: btcusdt + btce: btcusd + bitfinex: btcusd + bitstamp: btcusd + coinbase: btcusd + kraken: xbtusd + ITbit: btcusd) / 7

This formula on tradingview.com generates a composite index of the XBTUSD cross making the average of 7 exchanges and adding all the volumes togheter, the seven exchanges used are:

  1. Poloniex
  2. BTCE
  3. BitFinex
  4. BitStamp
  5. Coinbase
  6. Kraken
  7. ITbit

Doing this is also useful to see the total volume activity that will give you better results if you are using volume based indicators.

This week, volatility dropped significantly and with the imminent closure of the symmetrical triangle, a pattern that, as I said in the previous update, expects a continuation of the underlying trend.
Next update will include VWAP and deviation levels, but you can still consider the deviation levels calculated by the KAMA average as enough reliable.

In case of a catastrophic event the support area is 1180$-1500$.

Follow me also on Twitter where I started tweeting charts about bitcoin and some altcoins too using the TradingView.com platform

ITA Version here

Technical Update: KAMA, an underrated indicator

Kama moving average is a very interesting filtering technique developed by P.Kaufman.
This moving average has been designed to account for market noise or volatility, KAMA will closely follow prices when swings are small and the noise is low, instead when the price swings widen KAMA will adjust trying to follow prices from a greater distance. This trend-following indicator can be used to identify the overall trend, time turning points and filter price movements when the market is flat avoiding annoying whipsaw false signals trades.

At the moment i’m working on a modified version of this indicator with the help of the tradingview online platform, i added deviation lines from the KAMA average and settings have been optimized to better track XBTUSD price movements on daily and weekly chart.

Here’s an example of this indicator applied to a weekly chart of XBTUSD with some comments.
xbtusd_w

It’s evident that when the market is flat the KAMA average is relatively stable without giving false signals, when this happens you can try to trade deviation lines to catch bottoms or tops.

About this week the secondary positive deviation line is around 3200$, should you go short at that level? Well is at your own risk to trade against the main tendency that now is bullish, instead you might follow the trend buying at the midline or below it, i’m enough sure that today sell-off is healthy and the price was just moving back to the midline point (KAMA average) from the first positive deviation line.

Beware that because of very large price variation during the same bar the KAMA and its deviation lines can change a bit. The indicator is available for free at tradingview.com, just look for “KAMA – Enky v1.0”.

Your feedback is highly appreciated and will help me improving this trading tool.