Long Term Update: Weekly Price Channel

weekly_chart_xbtusd
Weekly Chart – Price Channel

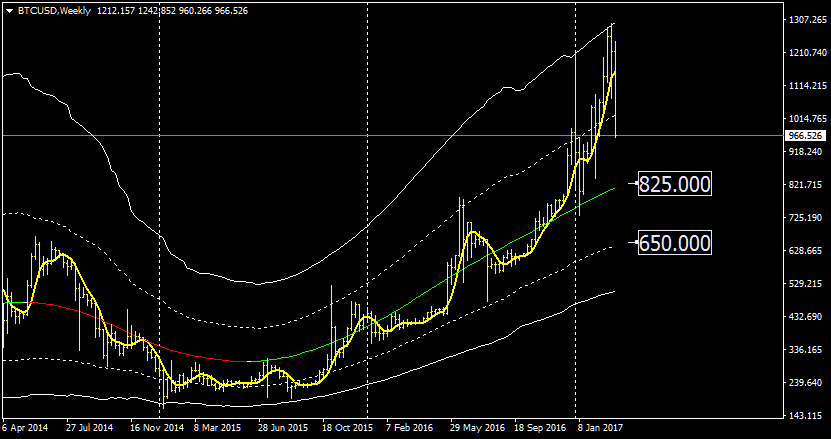
It seems that a correction has started on the weekly chart although the ALMA average is still bullish and not yet 100% confirming the move; sometimes a return to the mean or average is healthy for an uptrend, here the level is around 825$.

First deviation line is 650$ and the second one 530$. I fail to see an event strong enough to increase the volatility level so much to push this pair down to 530$, i remain confident that it’s not going so low and that the 650-825 usd price zone is a good support for long term buyers.

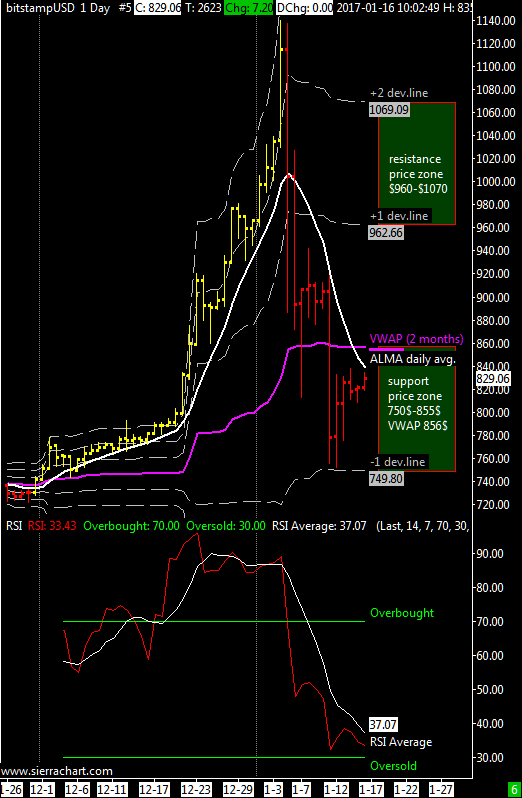
It is needed a close of this weekly bar above 1030$ to avert the risk of a correction of some weeks. The weekly RSI is above its mid-line or 50; in a strong uptrend the RSI usually stays above it as XBTUSD is doing since october 2015.

Weekly Range Update


eng
Daily Chart XBTUSD

XBT / USD weekly price range forecast 750$-855$ | The main resistance is the VWAP at 855$ and because this market dropped below it for the first time in months we can consider the cross XBTUSD in a weak position and the top at 1140$ done on January 3 is confirmed; to understand how it is positioned in the medium term our beloved BTC’s we need to see where the next bottom will be done.


As support is valid the first negative deviation line of the VWAP at around 750$ although I feel that the next minimum might be around 640$ or the second negative price deviation line of our mid-term VWAP .

In the previous update I wrote about my doubts if the VWAP at 850$ would have hold a second time the decline from the top after stopping that drop already once; the market indeed fell further but remained inside the support area that I indicated at that time.

The average of the RSI daily oscillator has finally drop near oversold levels, not giving a buy signal yet.

In cases of extreme drop support is price area between 580 and 660 USD.

Italian version here at bitchanger.com