Weekly Range Update: stronger then expected

xbtusd daily chart
xbtusd daily chart

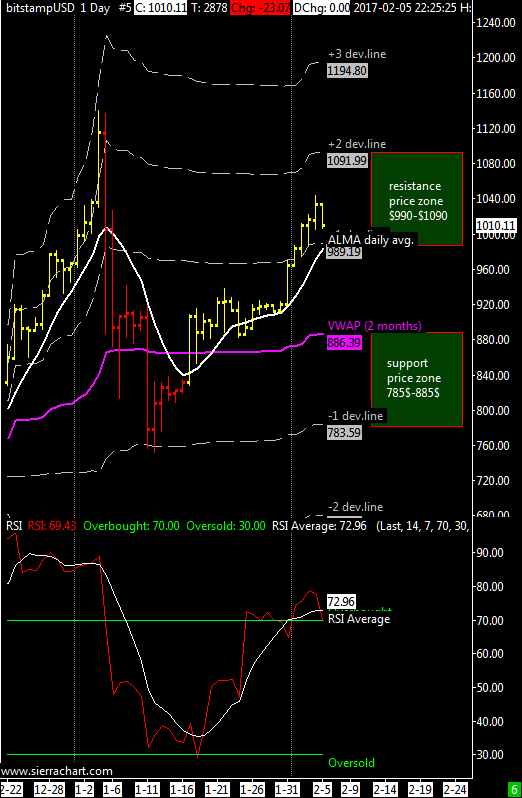
XBT / USD weekly price range is 935$-1095$ |Last week the cross XBTUSD has been stronger than expected so for this week the resistance is raised to 1100$, the support remains the VWAP at 935$.
The ALMA average has turned upward with the break of the resistance at 1015$ while t
he oscillator RSI has given a sell signal last week that has been ignored by the market confirming the strength of the bitcoin-dollar cross. The RSI has however pulled away from the overbought zone but remained above the mid-point of 50, thus remaining in bullish territory.

In short, the market is strong and has ignored my bearish worries of seven days ago; regarding my long-term position opened since 2014 I’ll continue to maintain it until I see some serious bearish indications  on the weekly and monthly chart. I remind everyone that the average carrying price of my position is around 570$ (three units opened at 681$ , 615$ and 417$ ).

In cases of extreme fall the support area is updated to 650-760 US dollars.

ITA version here.

Weekly Range Update

xbtusd daily chart
xbtusd daily chart

XBT / USD weekly price range $885-$1090 | As long as the XBTUSD pair remains above the medium term VWAP I don’t see any risks to the current uptrend to continue. The average ALMA is upwards since twenty days and the price has entered the resistance price zone published in the previous update, because of this I’m skeptic to see a further rise above $ 1090 without a correction considering also that the RSI oscillator has entered overbought territory, honestly I think that the odds of a correction are increased but the minimum should occur over the VWAP, above the $880 mark.

As support the VWAP is again valid and is updated to $885 even though first I consider as an intermediate support the $940 price level.

In cases of extreme fall the support area lies between 600 and 700 US.

Italian version at bitchanger.com

Weekly Range Update

eng
Daily Chart XBTUSD

XBT / USD weekly price range is 865$-965$ | The XBTUSD cross has moved above the VWAP regaining a position of strength, for this week the main resistance is the price zone between the first and the second deviation line or the 965$-1070$ price range; This technical rebound should stop in this price range (970$-1070$ ) now we need to wait to see where will be done the next relative maximum to understand how it is positioned in the medium term, given the situation of the weekly chart I expect that the next top will be lower then the other one of 3 January done approx at 1170$.

As support it is valid the first negative deviation line VWAP at around $ 765 although I feel that the last minimum done at $750 is confirmed and i think to be right considering now the VWAP at 865$ as main support for this week and probably the next one.

The daily RSI oscillator average has reversed to the upside but without going into oversold first, thus great buying opportunities have not yet been materialized.

In cases of extreme fall the support area run from 590 to 680 USD.

ITA version here at bitchanger.com