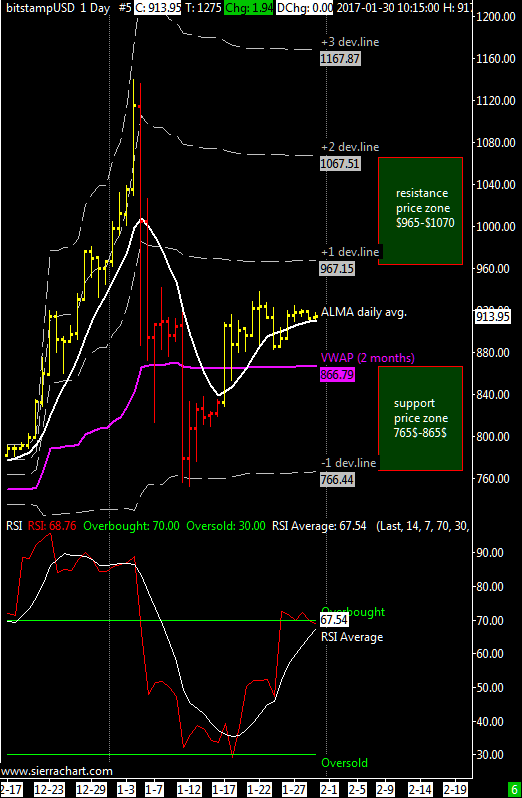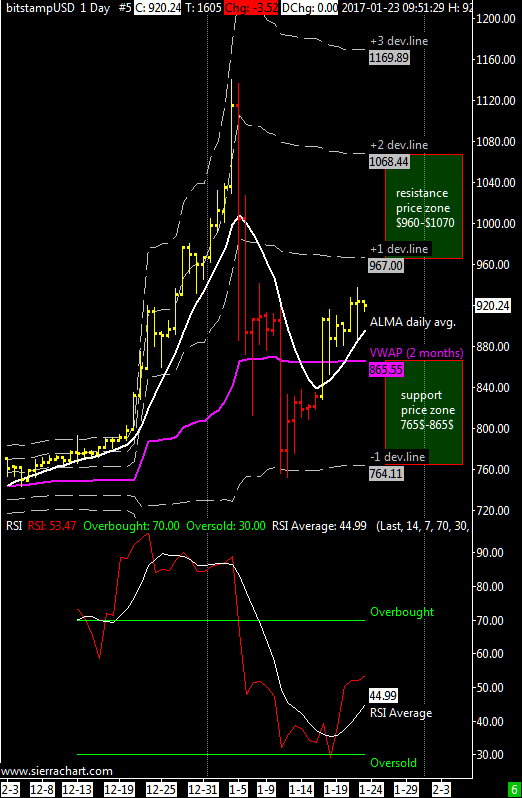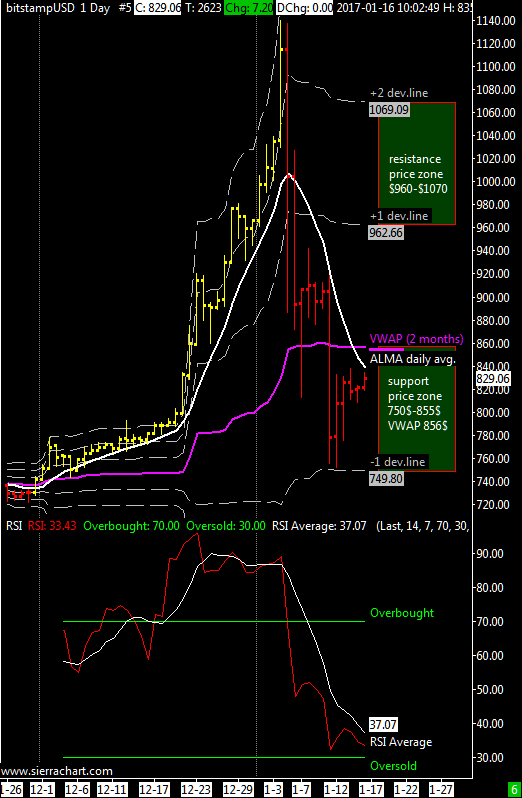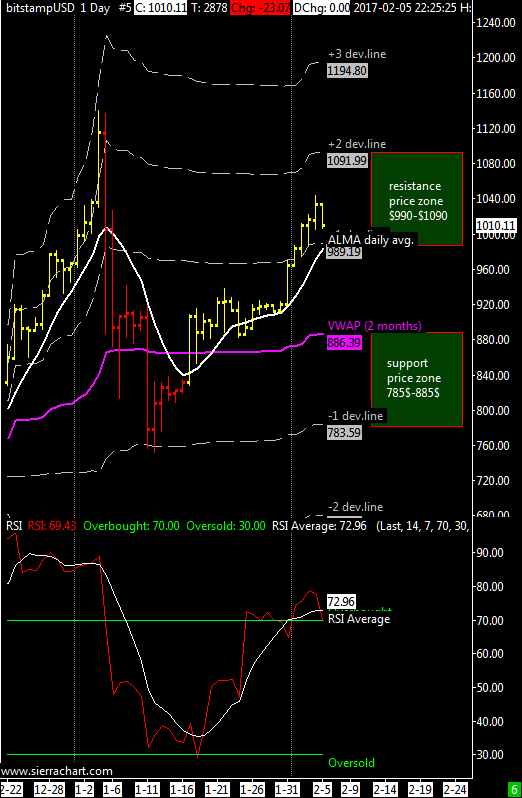
XBT / USD weekly price range $885-$1090 | As long as the XBTUSD pair remains above the medium term VWAP I don’t see any risks to the current uptrend to continue. The average ALMA is upwards since twenty days and the price has entered the resistance price zone published in the previous update, because of this I’m skeptic to see a further rise above $ 1090 without a correction considering also that the RSI oscillator has entered overbought territory, honestly I think that the odds of a correction are increased but the minimum should occur over the VWAP, above the $880 mark.
As support the VWAP is again valid and is updated to $885 even though first I consider as an intermediate support the $940 price level.
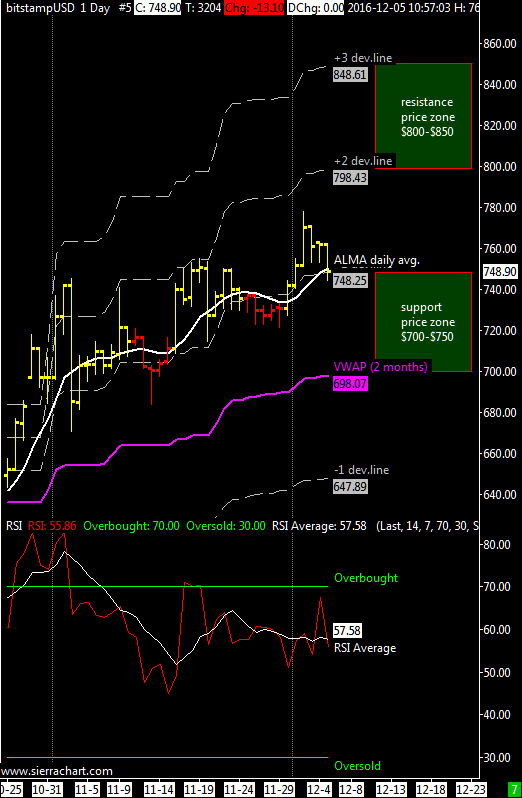
In cases of extreme fall the support area lies between 600 and 700 US.
Italian version at bitchanger.com