Weekly Range Update


eng
Daily Chart XBTUSD

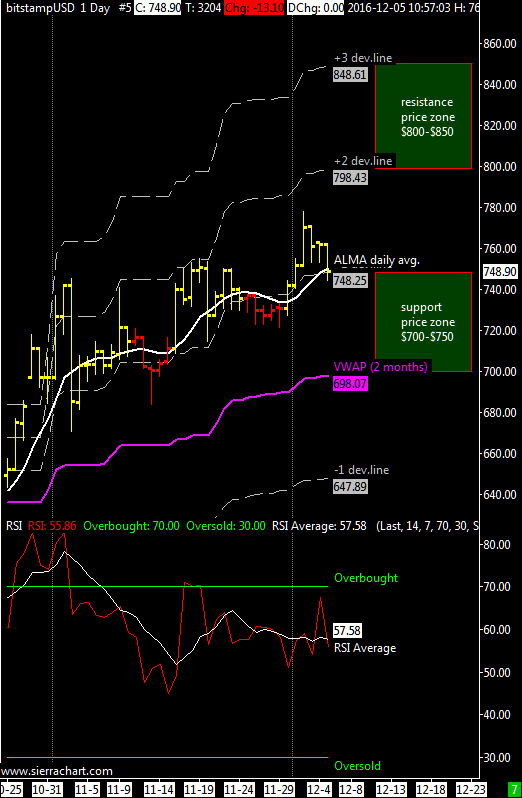
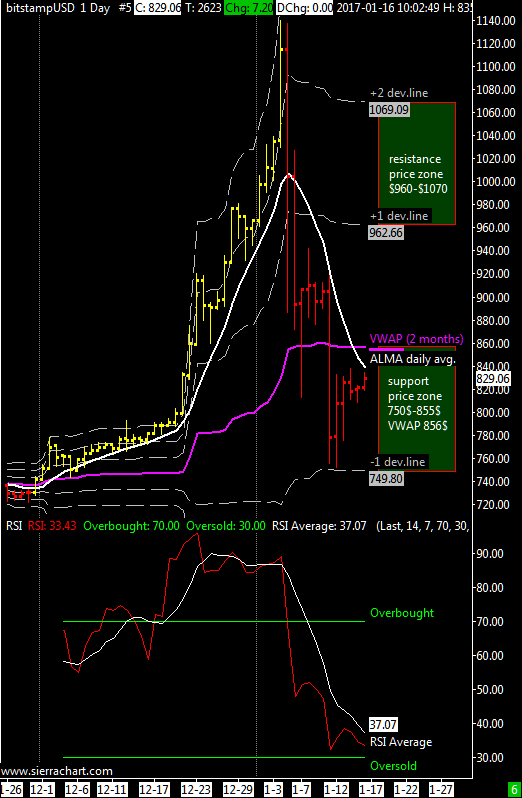
XBT / USD weekly price range forecast 750$-855$ | The main resistance is the VWAP at 855$ and because this market dropped below it for the first time in months we can consider the cross XBTUSD in a weak position and the top at 1140$ done on January 3 is confirmed; to understand how it is positioned in the medium term our beloved BTC’s we need to see where the next bottom will be done.


As support is valid the first negative deviation line of the VWAP at around 750$ although I feel that the next minimum might be around 640$ or the second negative price deviation line of our mid-term VWAP .

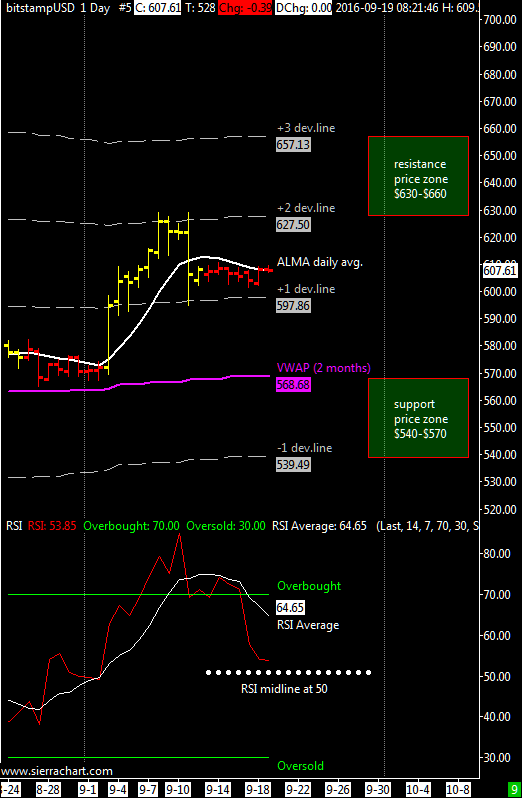
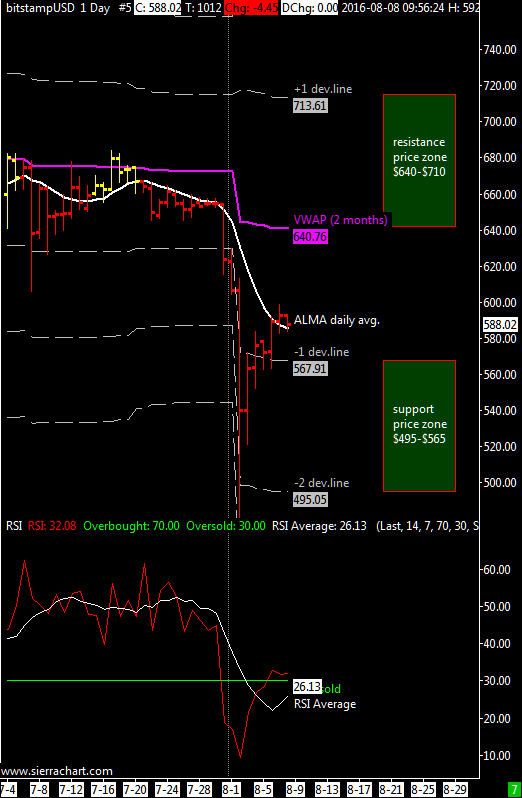
In the previous update I wrote about my doubts if the VWAP at 850$ would have hold a second time the decline from the top after stopping that drop already once; the market indeed fell further but remained inside the support area that I indicated at that time.

The average of the RSI daily oscillator has finally drop near oversold levels, not giving a buy signal yet.

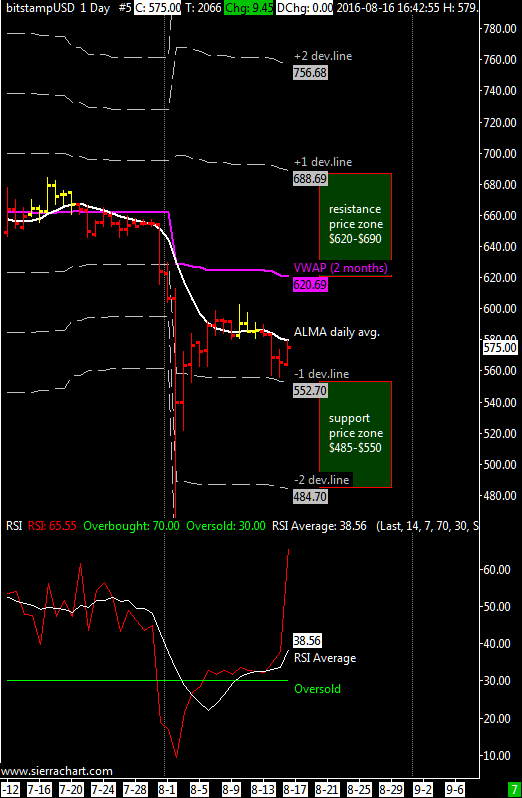
In cases of extreme drop support is price area between 580 and 660 USD.

Italian version here at bitchanger.com

Weekly Range Update

eng
Daily Chart XBTUSD

XBT / USD weekly price range of $820-$960 | The main resistance is the third price deviation line above the VWAP at $ 960 which also corresponds to an important resistance on the weekly chart that I showed in the previous update; the main support is the VWAP at approximately $750 even though I think it should work the first positive deviation line above the VWAP at $820. This week we’ll see if there will be enough strength to make a new high at $960 to conclude the year in the best possible way.

The average daily RSI oscillator is in overbought zone. The RSI on the weekly chart is also overbought and reached the value of 79, at this point there is a realistic chance that on the weekly chart a top is forming.

In case of extreme drop the support is the price area between 530 and $ 620 US.

Italian update here at bitchanger.com

Weekly Range Update

engXBT / USD weekly price range forecast $760-$800 | Even this week the support/resistance levels remain the same, the main resistance is the second dev. line above the VWAP at $800 while the support is still valid the VWAP at $720 approximately but with these levels of low volatility i think it will be support the first dev.line above the VWAP at $760. This week we’ll see if there will be enough energy to break the $800 and reach the next resistance at $840 by year-end.

The average of the daily RSI oscillator is in overbought territory. The RSI on the weekly chart is slighty overbought just above the threshold of 70, despite being overbought for some continuous weeks i think that a maximum on the weekly chart has not yet been done.

In case of extreme drop the support is the price area between 495 and 590 US.

Italian version here at bitchanger.com

Weekly Range Update

XBTUSD daily chart
XBTUSD daily chart

XBT / USD weekly price range of $700-$800 | For this week the main resistance is the second price deviation line above the VWAP at $800 while the support I believe it is valid the VWAP itself at about $ 700. The average daily RSI oscillator is not giving significant indications, it continues to remain above the mid point of 50 confirming the moderate bullish tendency. The RSI on the weekly chart is overbought but is just above the threshold of 70, it may still report the formation of a Top not having the bitcoin still broke decisively the $790 resistance on the weekly chart.

In cases of extreme drop support is the price zone between $485 and $570.

Italian version here at bitchanger.

Weekly Range Update

eng
Daily Chart XBTUSD @bitstamp

XBT / USD weekly price range $590-$660 | daily ALMA moving average is firmly up, the main resistance it’s now the price zone from the second to the third price deviation line  above the VWAP ($635-$660) while the support is always the VWAP at $590.

The situation has finally resolved in an upmove from $610-$615 to $635-$640 because as I said several times the ALMA average on the weekly chart is bullish and pushing up. The daily RSI oscillator average is in overbought zone and I think the bitcoin might do a correction perhaps to $ 610-615 before resuming the uptrend.

In the event of a sharp fall is always very valuable the support around $435.

Italian version here at bitchanger.com

Weekly Range Update

eng
Daily Chart XBTUSD @bitstamp

XBT / USD weekly price range $600-$635 | daily ALMA moving average is still up although its pace is slow, the main resistance remains the second price deviation line  above the VWAP at $ 635 while the support is always the VWAP at $ 565, the situation is not changing much from week to week with this slow buildup between 600 and 615 dollars.

I think is still valid the possibility that this accumulation will resolve with a move above 635 dollars because the ALMA average on the weekly chart has turned upward but again with not much speed. For those wishing to go short I recommend to wait at least $ 675 before trying and however i don’t recommend to do it if bitcoin reaches $ 670-675 in less than 24 hours.

The average RSI oscillator is approaching overbought area and this is a factor that worries me a bit because it could put an end to this slow rise that has lasted since September 22 when it did a small minimum at $593.

In the event of a sharp fall, as said many times is always very valuable the support around $420, now at $430 because the weekly tendency is still up and the support grow with time.

Italian version here at Bitchanger.com

Weekly Range Update

eng
Daily Chart XBTUSD @bitstamp

XBT / USD weekly range $598 – $634 | ALMA daily moving average is bullish and the main resistance is the second price deviation line above the VWAP @$630 while the support is always the VWAP @$570 although i think it will remain above 595$ also this week.

A rise above $630 is close for the same reason i told you severa times in the past weeks, XBTUSD is slowly accumulating and the weekly ALMA moving average already turned up but its slope is very low for now, in the upcoming weeks there should be a final breakout above $630.

The RSI oscillator has moved to an equilibrium point around 50 and there is enough room for more upside movement till the overbought zone.

In the event of a sharp fall, as said many times is always very valuable the support around $420.

Italian version here at Bitchanger.com

Weekly Range Update

engXBT / USD weekly range $570 – $630 | ALMA daily moving average is flat and the main resistance is the second price deviation line above the VWAP @$630 while the support is always the VWAP @$570. For this week i reduced the volatility setting of the sierrachart vwap indicator because the spread between the lines was too high after the bitcoin collapse of August, this adjustment was necessary and now as you can see the new setting better identifies supports and resistances. (For who uses this indicator with Sierrachart trading platform i adjusted the multiplier from 1-2-3-4 to 0,66-1,33-2-2,66)

I think that XBTUSD should remain below $ 630 also this week but a rise above this resistance is close, why? Because the ALMA average on the weekly chart appears to have turned upside and the breakout above $630 would be the confirmation of this reversal. For those wishing to go short I advise to wait at least $ 660 for this week before trying a short sell.

The RSI oscillator has reversed to the downside BUT since we are in a bullish move the RSI threshold of 50 provides support. An important point of the RSI indicator is the midline at 50 because it acts as support or resistance. Around this level there are many fake-outs, sometimes the RSI will fall just below 50 causing sell stops then suddenly the price just rebound. Likewise if crossing above 50, shorts will be covered only to see a resumed downward move. You must pay attention when the RSI is near this midline.

In the event of a sharp fall, as said many times is always very valuable the support around $420.

Italian version here at Bitchanger.com

Weekly Range Update

eng
Daily Chart XBTUSD @Bitstamp

XBT/USD weekly range $ 580-$ 630 | ALMA daily moving average is going flat after many days of good advance and the main resistance is now the first positive deviation line of the VWAP at around $ 630.

I think the cross XBTUSD will remain below $ 630 this week with a second resistance at about $ 680. The weekly ALMA moving average is apparently turning up but i don’t expect a break above $630 because also of an high reading of the RSI oscillator that is in overbought territory above the 70 threshold value..

I said in many previous updates that in case of a volatility spike due to another price crash the deal is to buy slightly above $420.

Italian version here at bitchanger.com

Weekly Range Update


eng
Daily Chart @bitstamp

XBT/USD weekly range $ 550-$ 615 | ALMA daily moving average is still slightly bearish and the main resistance is unchanged at VWAP around $ 615.

I think the cross XBTUSD will remain below $ 615 this week with a second resistance at about $ 680. The weekly forecast is slighlt bearish but i don’t expect a break below $550 because of low volatility.

In case of a volatility spike due to another price crash the deal is to buy slightly above $420.

Weekly Range Update

xbtusd daily chart @bistamp

XBT/USD weekly range $ 550-$ 620 | ALMA daily moving average is slightly bearish and the main resistance for now is always the VWAP at $ 620.

I think the cross XBTUSD will remain below $ 620 this week with a second resistance at about $ 690. Volatility has stabilized. The weekly forecast is flat, i don’t expect a break above $620 or below $550.

The average of the RSI  oscillator turned upward and is giving some bullish indications but only a breakout above $ 620 would confirm a bullish scenario.

This article at steemit
Italian version at bitchanger.com

Weekly Range Update

eng
XBTUSD @bitstamp

XBT / USD weekly range $ 495- $ 640 | ALMA daily moving average is still bearish and the main resistance is the VWAP which adjusted to about $ 640 after the flash crash caused by Bitfinex.

I think the cross XBTUSD will remain below $ 640 this week with a second resistance at about $ 715. Volatility after the peak of last week is now stabilizing. The weekly forecast remains bearish, I think we will continue to see the bitcoin below the VWAP to $ 640. The actual price rebound could already be exhausted, if so then i expect a retest of the $565 price level.

The average of RSI oscillator is turning upward but has not yet given a bullish signal, it is at 26 and below the threshold of 30 that identifies the oversold zone.

Because of bitfinex exchange going offline i’m moving back to using bitstamp data.

This article at steemit
Italian version at bitchanger.com