
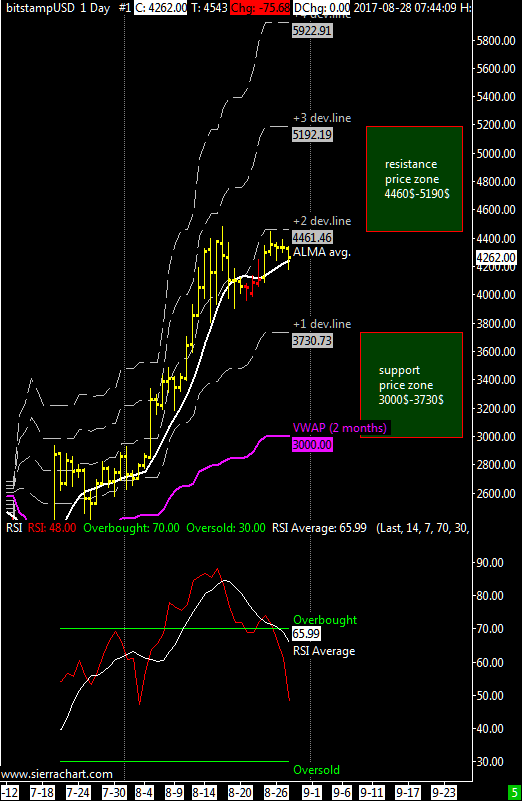
XBT / USD weekly price range is 3700$-4460$ | The XBTUSD cross slowed its rise last week togheter with a volatility contraction, failing to break through the all time high at 4480$.
However, we must not forget that bitcoin remains in a strong position staying all the time above the first positive price deviation line of the VWAP, but i’ve to notice that for more than ten days it has stayed below the second price deviation line now at 4460$, which is precisely a sign of slowdown.
At this point I think the XBTUSD can make a correction with a strong support located at 3700$ this week or next, this support level should stop any further weakness, I do not expect a VWAP test at 3000$.
The average of the RSI oscillator went below the threshold level of 70, giving a theoretical sell signal, but the RSI is at 50, an intermediate value that normally acts as support during strong upward trends as I have said many times in the past.
In case of extreme fall, the support area is 2150-2700 USD.
ITA version here.
