
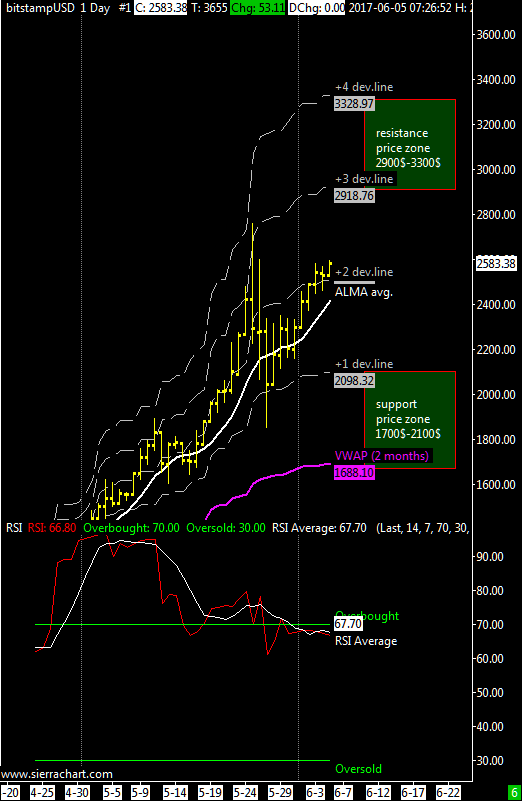
XBT / USD weekly price range at 2100$-2900$ | The VWAP is just below 1700$ and the XBTUSD cross is always above it confirming mid-term bullishness.
I have told you many times that when a market is in a very strong position it can move between the first and second price deviation line except for rare cases where it can be between the second and the third line.
From a couple of days back it’s above the second price deviation line and I think that the current rally will continue pushing the bitcoin towards 2900$.
The average of the RSI oscillator is just below the overbought area and I think that bitcoin will ignore this indicator that may remain overbought for a certain period of time due to the fact that the dominant timeframe is the weekly one and as mentioned earlier I think this aspect can push bitcoin over the previous maximum of 2750$.
In case of extreme fall, the support area is 1050-1450 USD.

First of all, thanks for another update.
In your yearly long term update you said it would be difficult for XBTUSD to go higher than 2900 USD. It is almost at that price now. A few updates ago you also said that a correction is to be expected but that the typical high volatility was not there yet. Now we have higher volatility.
Taking these two things into account, do you think we’re in for a big correction according to the “extreme fall” scenario, or possibly that we’re at the top of a multi-year bull run and we might see a long decline from here, like after December 2013?