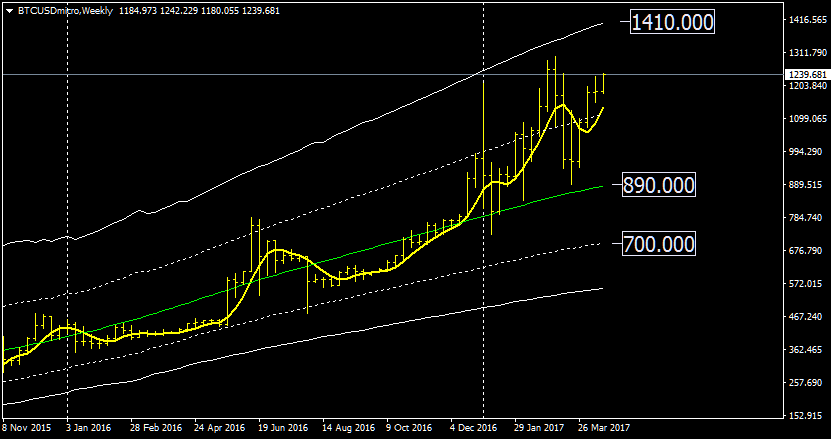
It’s pretty obvious that XBTUSD is staying above the central line of the price channel shown in the weekly chart. The low of 5 weeks ago caused by bitcoin unlimited has been made above the midline of the channel and this is a bullish indication.
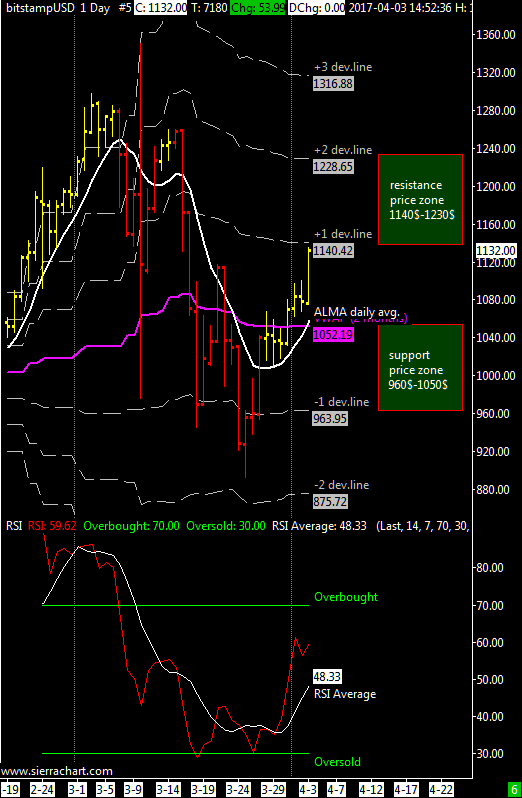
As you know, this indicator calculates a regression on past prices and projects resistance and support lines using the average volatility of the underlying asset, if there is sudden shift in volatility the indicator will try to adapt to this new information coming in and the deviation lines will change accordingly.
If volatility change is not dramatic the calculated resistance and support lines will remain fairly stable; at the moment the new resistance area where the next top might occur is between ~1250$ and ~1410$.
As a side note i’d like to add some words about the next top, it is very important to make it above the previous one to confirm the underlying bullish tendency; if bitcoin fails and moves below 890$ the implications would be bearish enough to see a minimum just above 700$.