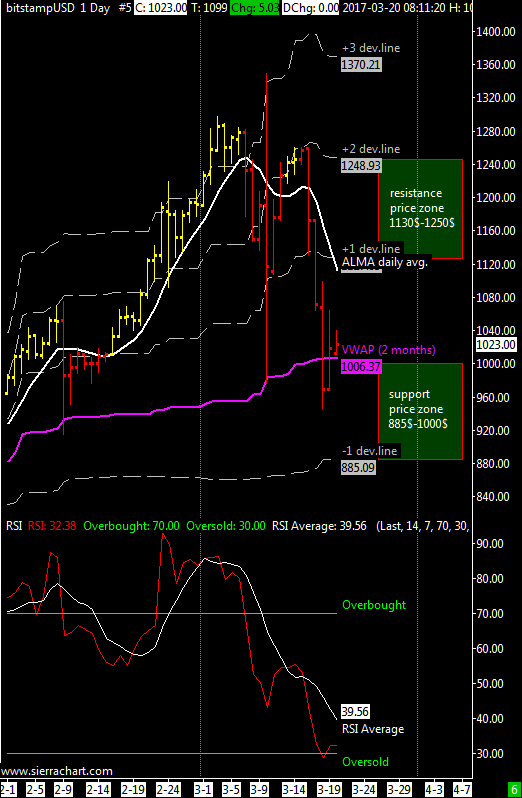
XBT / USD weekly price range is 900$-1125$ | The range for this week is similar to the previous week. XBTUSD remains in a weak position below the VWAP and below the ALMA moving average.
I think that the support at 900$ is solid; resistance levels at 1125$ and 1235$.
The ALMA average is still bearish and the RSI oscillator has made a double bottom just above the oversold thresold. I see the possibility of a move above the VWAP up to 1100$, at the same time a failure to pass 1010$ would be bearish.
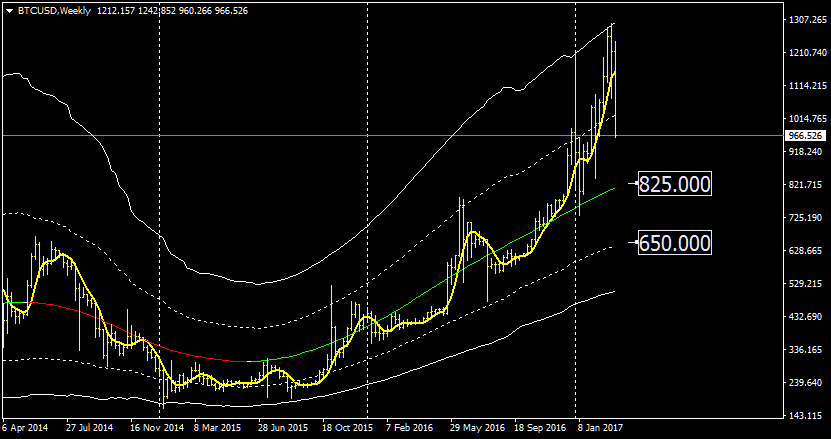
In cases of extreme fall the support area is 650-825 US dollars.
ITA version here.