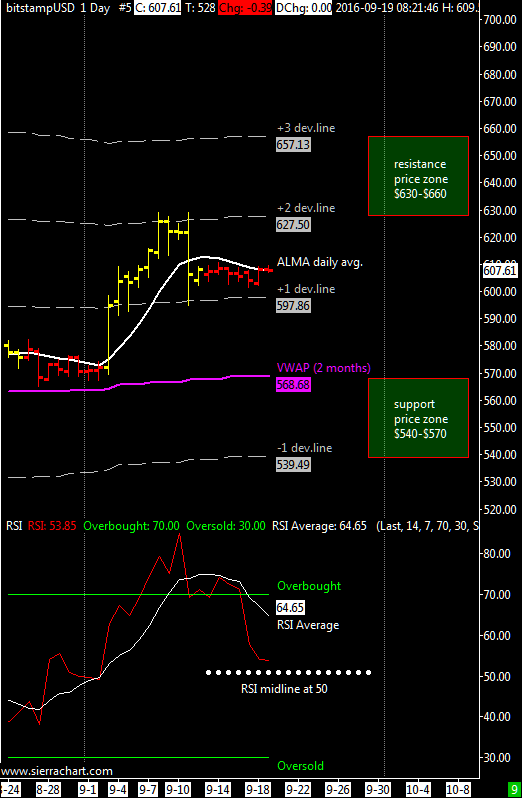
XBT / USD weekly range $595 – $630 | ALMA daily moving average is flat and the main resistance is the second price deviation line above the VWAP @$630 while the support is always the VWAP @$560, similar price range of the last week.
I think that XBTUSD should remain below $ 630 also this week but a rise above this resistance is close for the same reason i told you in the previous update, the weekly ALMA moving average is slowly turning upward. For those wishing to go short I advise to wait at least $ 660 for this week, more probably next week, before trying a short sell. In any case i do not recommend to go short for prolonged period of times because the underlying trend is still up.
The RSI oscillator has moved to oversold territory and failed to stay above the threshold of 50 that usually provides support. The average of the oscillator apparently is doing a bottom with the RSI itself that already crossed the thresold of 30 giving a bullish signal.
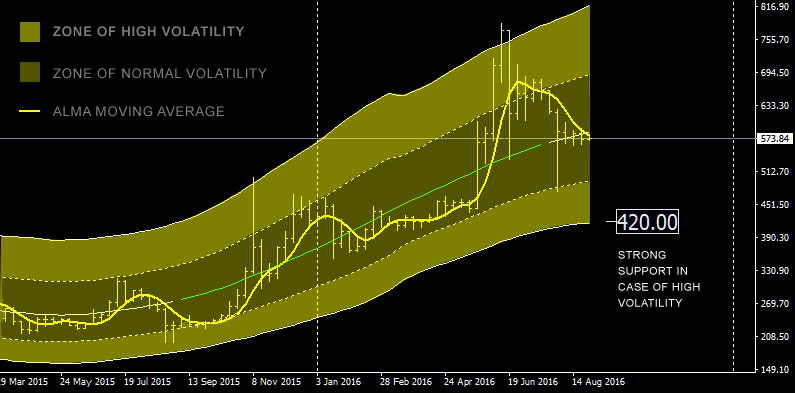
In the event of a sharp fall, as said many times is always very valuable the support around $420.
Italian version here at Bitchanger.com