Long Term Update: at resistance?

From my previous update: “..About the recent prolonged period of low volatility i’m observing an increased volume activity among all the biggest bitcoin exchanges, this let me think that bitcoin is probably accumulating to later break the trading range and move above $250. This break would be confirmed with a positive reading of the Chaikin Indicator..”

Well at the end it happened and a volatility increase in the right direction moved XBTUSD above the trading range ($210-$245), it is interesting to observe that a very strong volatility peak happened on October 22 but instead of topping this market continued to push upward (observe below chart),
chart
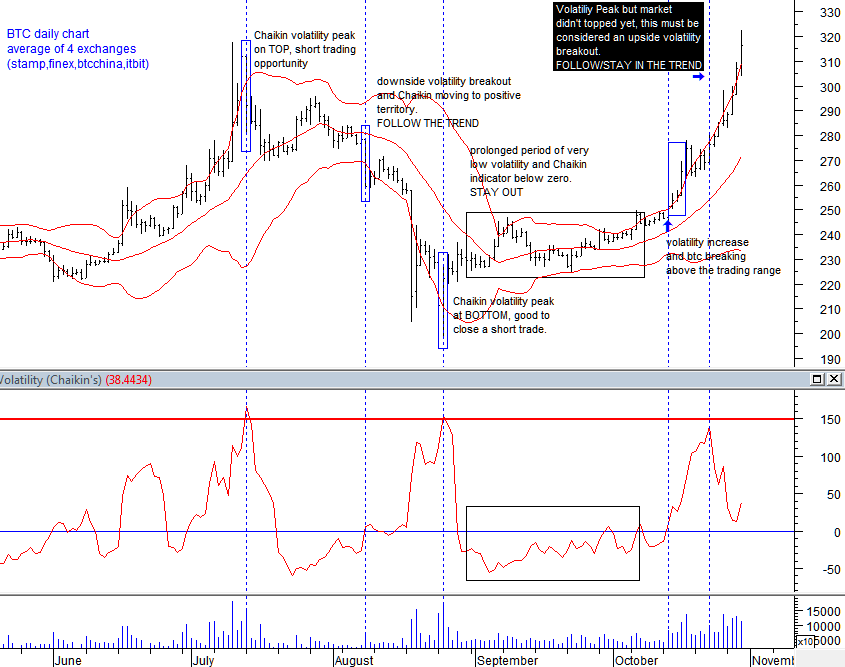
at this point i think that an intermediate top might happen with a second volatility peak probably within November 10th.

At resistance?

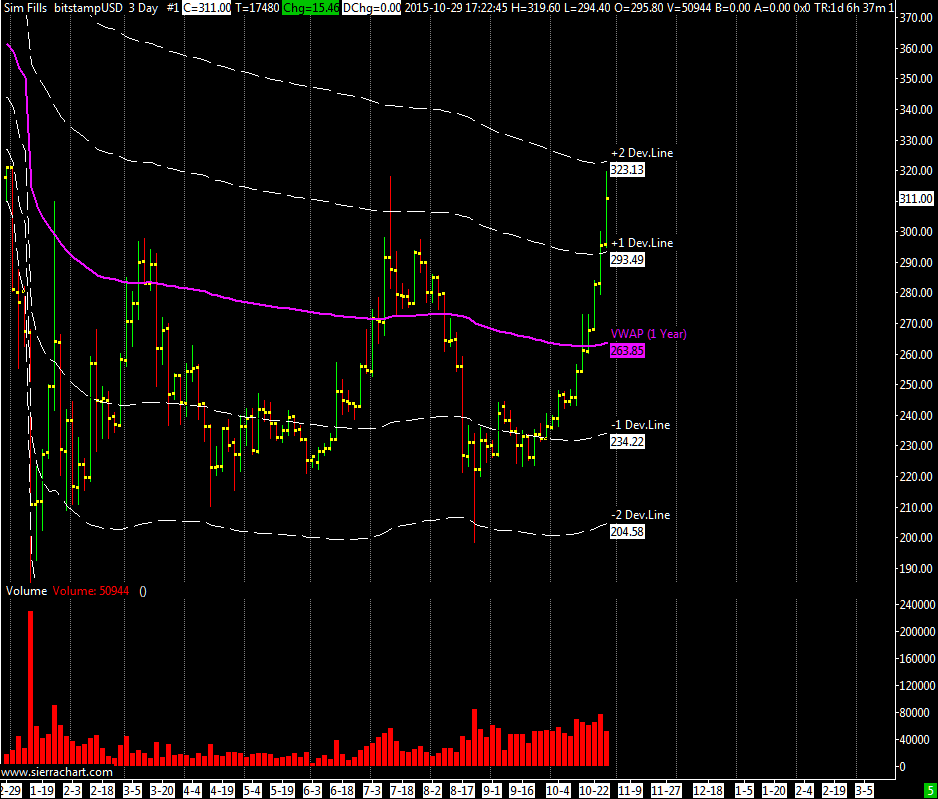
Checking price levels it seems that it’ll be hard to pass $320-$330, the 1Year Vwap is at $264 and the 2nd positive deviation line stands at $323, only %5 chance to move above in the short term despite this i think that a final top might happen at or below $400 before a strong correction will take place. If i’m wrong a strong support lies between the VWAP and $280 (where it happened the first volatility peak).
bitstampUSD 3 Day #1 2015-10-29 17_33_14.988

If you want to support this blog you can open an account at bit4x using my referral link, clicking here . Thank you.

Long Term Update: Again on volatility

After having proposed with my previous update an interesting template about volatility breakouts, I introduce today a well know indicator about volatility: the Chaikin volatility indicator. Most of those who follow me probably already knows that volatility is ultimately responsible for a traders profits, since if a market does not fucking move (like btc is doing since September) then there is no way to make money from it:)
It’s therefore crucial to recognise those times when volatility is picking up as this offers the opportunity to make a decent trade.
Developed by Marc Chaikin, the Chaikin volatility indicator characterize volatility by calculating the difference between the high and low for each period or trading bar. It measures the difference between two moving averages of a volume-weighted accumulation distribution line.

As you can clearly see when the Chaikin is below zero nothing is going on in the market and during these times you should refrain from trading and wait for the Chaikin to tell you when things are getting interesting. Chaikin is thus excellent to avoid overtrading.

chart

Once the Chaikin peaks, you know that you can start to think about closing your trade or opening a new one in the opposite direction (less recommended).
About the recent prolonged period of low volatility i’m observing an increased volume activity among all the biggest bitcoin exchanges, this let me think that bitcoin is probably accumulating to later break the trading range and move above $250. This break would be confirmed with a positive reading of the Chaikin Indicator (standard settings of 10/10 applied to a daily chart).

If you want to support this blog you can open an account at bit4x using my referral link, clicking here . Thank you.