Long Term Update: Losing steam?

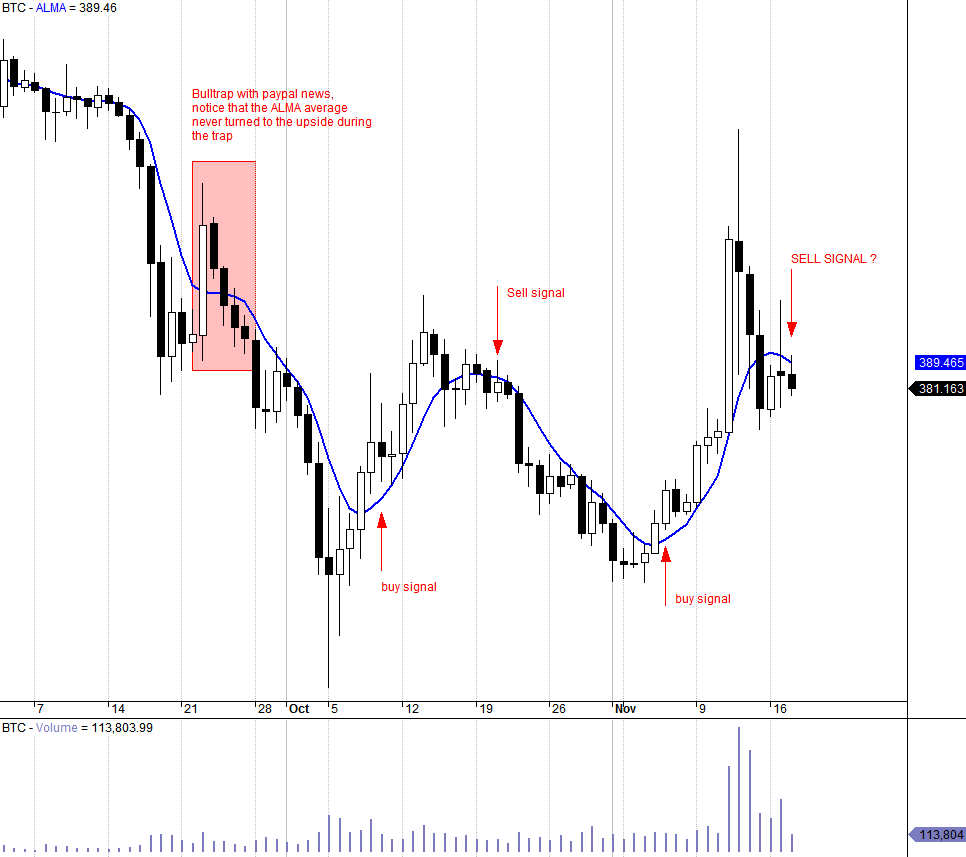
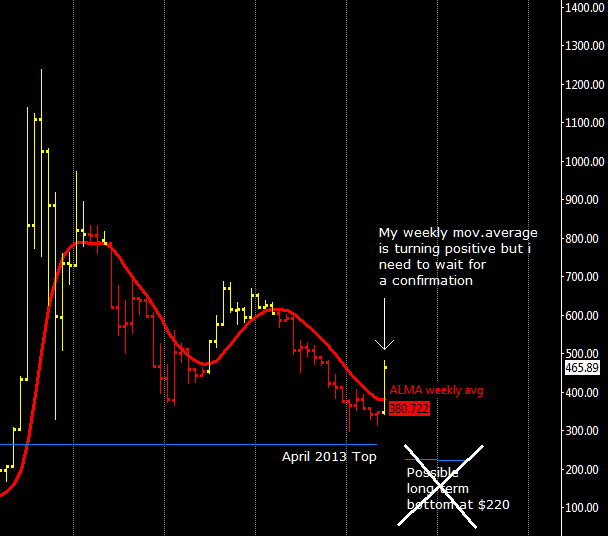
This is a daily chart of 4 main exchanges (bitfinex, bitstamp, btce and btc china data averaged down), the blue tick line is the ALMA moving average. As you can see in the last 2 days the average turned bearish again, this doesn’t mean that XBT/USD will fall for sure, it might be a false signal but considering that also the weekly ALMA turned again bearish failing to confirm the bullish reversal of last week the obvious conclusion is that this market is losing a bit of strength and the risk of a downswing is around the corner. I think that as long as it stays above 360$-365$ is fine despite a negative outlook by those averages but a break to 350$ or lower would confirm the bearishness in the currency pair.

chart

Long Term Update: True Break Out?

After trading in a range that lasted for almost five weeks (300$-380$ price zone), bitcoin prices have made a run for it. The breakout above the ALMA weekly moving average (now at 380$) happened very quickly with high volume. Given the volume action of the last few days, another breakout above the $500 level at a first glance seems likely in the near future. The first decent resistance is the one year VWAP now at around $550 and it’ll be a true test to see if XBT/USD is still in a correction inside a long term bull market.

As i’ve said the weekly moving average i use is turning positive but i need to wait this and the next week to see if the reversal is genuine or not, the risk that we are just seeing a giant bull trap is not excluded; it might happen a repetition of may-june pattern where after an upmove of 250$ the market stalled and resumed the downtrend in July.

For the time being the possibility to reach a long term bottom at $220 by year-end is fading away, at this point i’ve to consider the recent bottom at $275 as an important one and again above the top of the previous cycle did at 266$.

chart

Short Term Update: Trade idea for next 24-48 hrs

Since the early June 2014 high at ~$685, the XBT/USD daily chart has been in a downtrend. By early October, it reached $275 and a move lower towards $220 is not excluded as i said on my previous update. For now a good trade idea could be to buy on the dip around $307 with a take profit at $320; or alternatively go short now with $307 as a target and a stop loss placed just above $335.  Recently I dusted off an old program that uses Elliott Waves Concepts and with a short term analysis i’ve a similar target, $310 and $300. The analysis has been made using minute and minuette as order of degrees; it’s common knowledge that minute or minuette wave degree is intended for few days and hours as investment horizon.
chart