
Something happened last Sunday around 15:30 GMT however and changed things a bit, an approximate 30$ drop in the XBT/USD in about 5 minutes followed by 60$ rally back up in the late afternoon. Supposedly this drop had to do probably with a single investor having fun at bitstamp, during the recovery from $275 bottom we have seen a nice 30k bitcoins wall in the order book. Whatever it was, bitcoin approached very closely the april 2013 bottom at $266 without breaking it.
If Sunday’s lows are broken this week or the next one, then traders should reassess their outlook and give more credence to that sell-off Sunday being a warning sign rather than a shakeout. I can’t not forget that this market is spending a lot of time below my long term averages:
- The weekly ALMA moving average i use on the weekly chart, now at $440
- The 50 and 200 days moving average i use on the daily chart, respectively at $440 and $520
- The 1 year long term VWAP, now stable at $515
As long as it stays below these long term reference levels i can’t be bullish, for this week and the next one this market might rebounce up to the first negative deviation line of the 1 year VWAP, as illustrated below the level is at $370. Once reached this level i expect the drop to resume.
I included also a net volume lecture of btc china exchange, it represents the weekly moving average of the difference between volume made on an uptick less volume made on a downtick thus giving us the buying or selling pressure; pressure that is now positive; at least at btcchina exchange traders are buying at these prices.
I can speculate that the final bottom could be just above $200, why? well the drop started in June is now 18 weeks old and most of the time a price movement doesn’t exceed 25-30 bars or weeks in this case. Assuming another 8 weeks of falling prices (2 months) as a target i’ve the $200-$220 price area, using in the computation the current level of volatility.
To conclude i think that is very unlikely to see bitcoin going under $200 by the end of the year and before opening a new long term trade i need this market to react enough to turn positive again my weekly moving average.
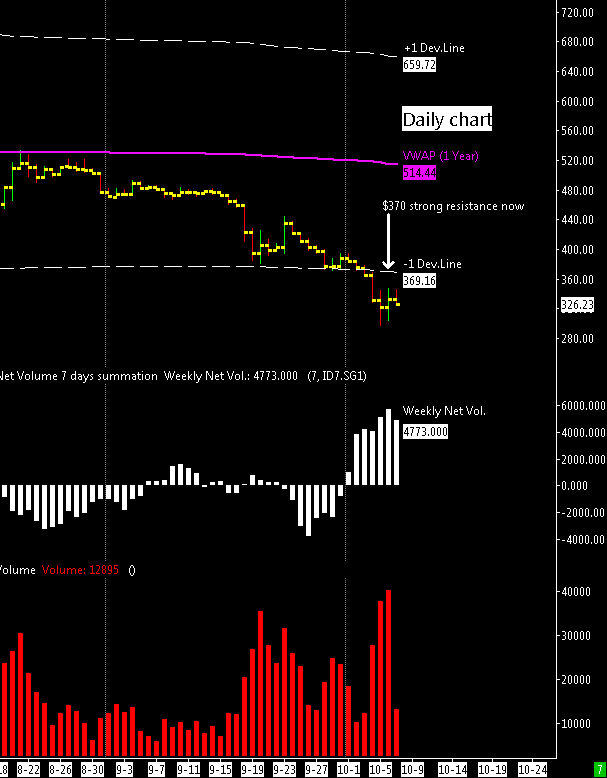
Chart from Sierra Chart trading platform, Courtesy of Sierrachart, Inc.
