
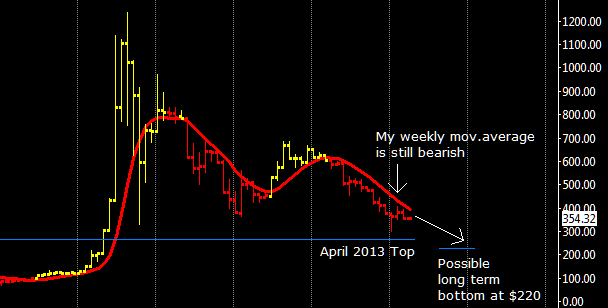
It’s has been a while that i don’t post a long term weekly chart and i think it can help us to better understand where XBT/USD is headed. Price is not going to take off any time soon (it recently moved below the $360 support price i was monitoring in the last days), but more likely to continue its fall towards a new bottom below the 266$ April 2013 top, i expect the bottom to be somewhere near $220 for different reasons.
First, i’ve there at $220 an important deviation line of the 1 year VWAP , second considering actual bitcoin volatility it is very unlikely to move below $200 in the next two months (end of the year), and for “unlikely” i mean a 5% possibility (2 sigma event).
And third, and it is the most interesting, miners production cost for 1 btc ranges from $100 to $200 depending from their hardware amortization expense and running costs, mainly electricity. As bitcoin approaches their production cost value as more miners will feel the pressure and it’s difficult to imagine their reactions but i’m confident that they will avoid to panic sell because they must protect their business at the cost of some temporary losses or missed profits.
If they instead decide to stop the mining farms and to liquidate most of their accumulated bitcoins then it might repeat what we’ve seen in 2011, a severe bear market with dropping network difficulty. Bottom? probably around 80$-100$, a nice 3 sigma event or 1% chance to happen but it is very, very unlikely to happen.
Month: October 2014
OFFTOPIC: Donations
First of all I’d like thank everyone for contributing to this blog with donations since 2011; said this I kindly ask you to don’t send donations less than 0.01 bitcoins because there are problems with coinbase to process transactions below 0.01 btcs. I already reported this issue to coinbase technical stuff, i’m waiting an answer.
Thank You
Long Term Update: daily chart
In my previous update I had hypothesized a price movement up to $ 370 instead the market has reached $ 415, showing more strength than expected, a sign that investors are looking bitcoin as underpriced.
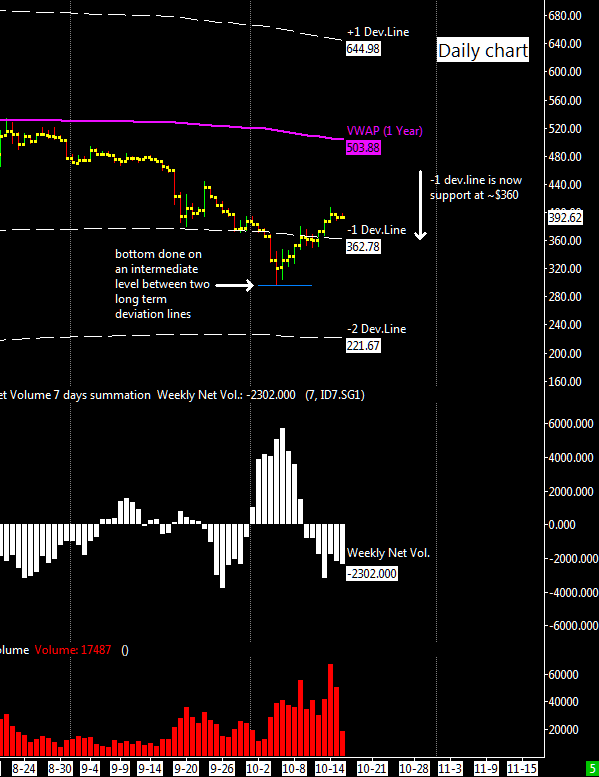
In the chart that I attached below you can see the potential levels for the next few weeks and months; the recent $275 bottom corresponds to an intermediate level between two long term deviation lines, the first line of deviation that is at $ 360 is now become support and is no longer a resistance as previously thought. I believe that in the next days the market will stay above $ 360, once complete this consolidation phase we will see the true intentions of the market: to return below 360 dollars with strong volumes indicating a possible scenario of a new low at around $220; on the contrary, a break through the 430-440 dollars resistance level (an intermediate level between $360 and the vwap at $500) would mean a retest up to the long-term average VWAP, now just above $ 500.
It will be very important to observe what the market will do at around $ 360 because below this level it would be again fully bearish. I conclude spending two words about volume activity, my weekly net volume indicator is again bearish for this particular exchange (btc china), but also for the others ones (bitstamp, bitfinex, etc..) signalling a potential topping area for this market, at least for the short term.
Long Term Update: Shakeout or A Warning of Something Bigger?
Something happened last Sunday around 15:30 GMT however and changed things a bit, an approximate 30$ drop in the XBT/USD in about 5 minutes followed by 60$ rally back up in the late afternoon. Supposedly this drop had to do probably with a single investor having fun at bitstamp, during the recovery from $275 bottom we have seen a nice 30k bitcoins wall in the order book. Whatever it was, bitcoin approached very closely the april 2013 bottom at $266 without breaking it.
If Sunday’s lows are broken this week or the next one, then traders should reassess their outlook and give more credence to that sell-off Sunday being a warning sign rather than a shakeout. I can’t not forget that this market is spending a lot of time below my long term averages:
- The weekly ALMA moving average i use on the weekly chart, now at $440
- The 50 and 200 days moving average i use on the daily chart, respectively at $440 and $520
- The 1 year long term VWAP, now stable at $515
As long as it stays below these long term reference levels i can’t be bullish, for this week and the next one this market might rebounce up to the first negative deviation line of the 1 year VWAP, as illustrated below the level is at $370. Once reached this level i expect the drop to resume.
I included also a net volume lecture of btc china exchange, it represents the weekly moving average of the difference between volume made on an uptick less volume made on a downtick thus giving us the buying or selling pressure; pressure that is now positive; at least at btcchina exchange traders are buying at these prices.
I can speculate that the final bottom could be just above $200, why? well the drop started in June is now 18 weeks old and most of the time a price movement doesn’t exceed 25-30 bars or weeks in this case. Assuming another 8 weeks of falling prices (2 months) as a target i’ve the $200-$220 price area, using in the computation the current level of volatility.
To conclude i think that is very unlikely to see bitcoin going under $200 by the end of the year and before opening a new long term trade i need this market to react enough to turn positive again my weekly moving average.
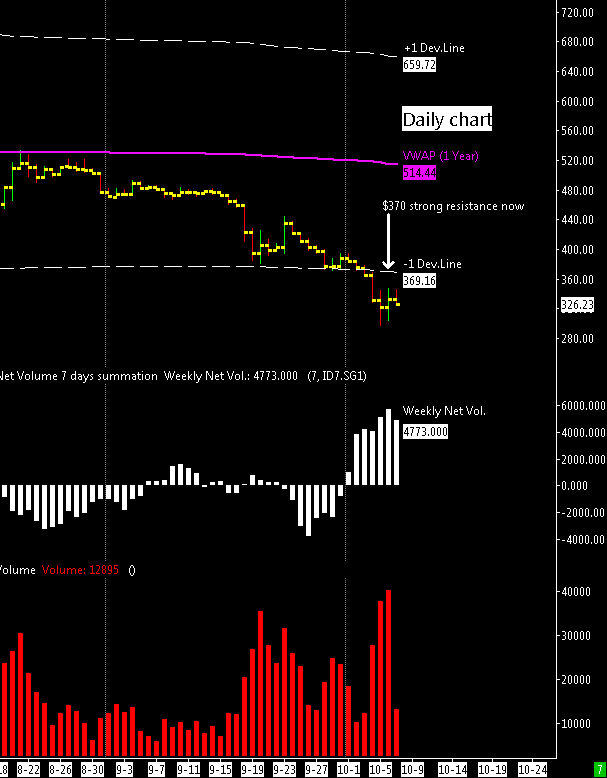
Chart from Sierra Chart trading platform, Courtesy of Sierrachart, Inc.
