Short Term Update: sick drop? I’m not much surprised

I dunno why, but i’m not surprised to see an heavy selling activity on Sunday, probably too much bored traders at Bitstamp and/or Bitfinex; jokes apart i’m starting to be annoyed by the short term behaviour of this market, totally disconnected from the news with sudden heavy selling activities typical of an immature and unstable market and for unstable i mean the volatility level with its high variance or unpredictability as main characteristic.
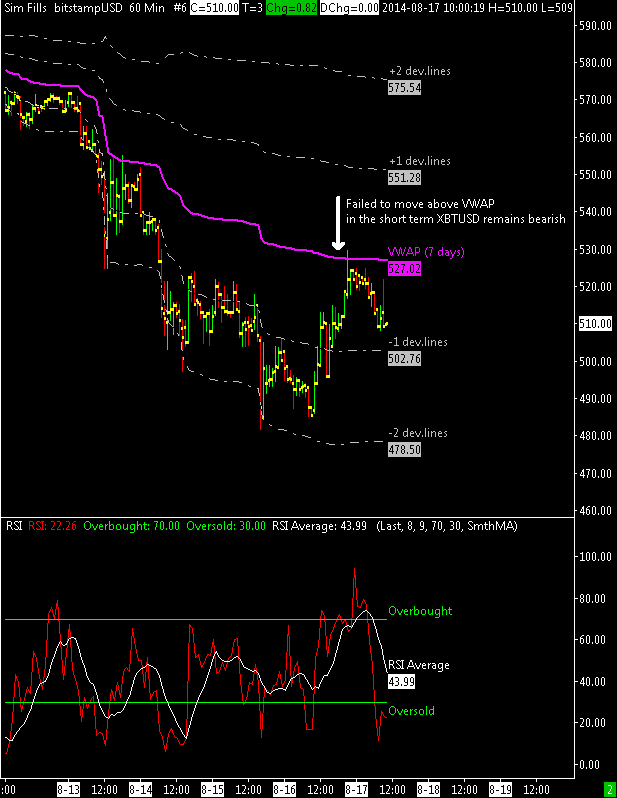
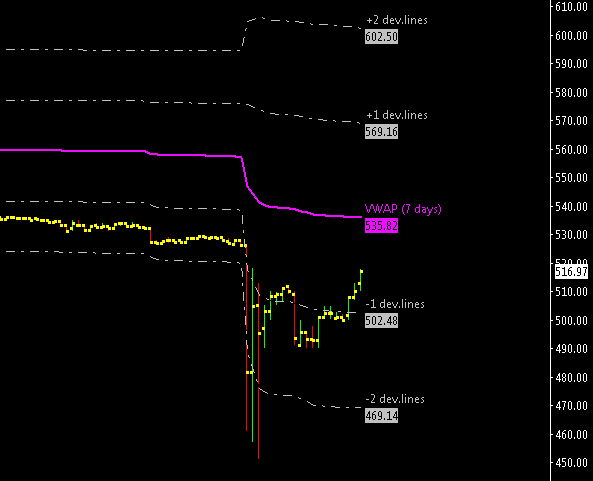
Aniway $495 has been broken and now it will work as resistance in case of a rebounce, in the meantime the VWAP is quicly readjusting itself below the $500 mark. 
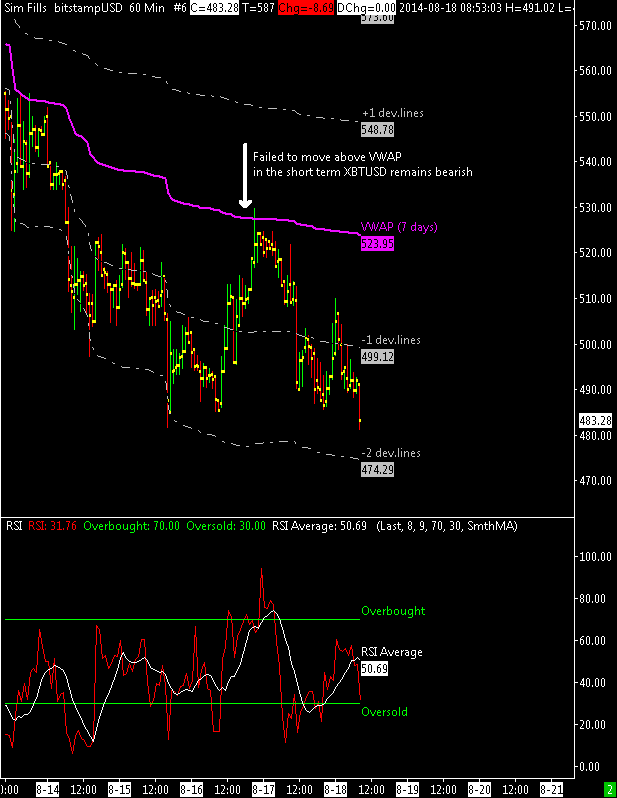
Support for next week should be in the $430-$440 price zone, resistance at around $495-$500.

The question now is whether this is a high volume breakout that portends much lower prices, or a high volume shakeout that will quickly be reversed by a strong reaction with good volumes and the price coming back above $500. Considering the low level nature of the investor community at the biggest bitcoin exchanges, personally I am leaning towards the shakeout theory rather than toward the breakout theory, it’ll be important to see how it’ll start the next week, the first 2-3 days.
 
chart

Short Term Update: Sideways

Trading sideways is when a security doesn’t make higher highs or lower lows. It just stays within the same trading range over any period of time, it’s a lull in between a bull market, when a security trade higher, or a bear market, when they are on a downward trend. Again XBT/USD is entering a congestion because it’s not too far from a period of ten days inside a specific range, the price zone from 480 to 540 dollars. 
The short term VWAP is now perfectly in the middle of the trading range, at 510 dollars. The volatility of the last seven days dropped further more and so the range defined by the deviation lines, as i indicated in the chart the last tops has been made on the first and second deviation lines with the last $522 top done on a RSI divergence.
Now the rsi is forming a new divergence with an higher bottom and bitcoin price doing a lower low, it could be a buying opportunity if today or tomorrow XBT/USD drops down to $490-$495. If someone want to try to go long there because this is short term operativity the stop loss must be very tight 5 or 10 dollars at max with a target around $515-$520.

chart

Short Term Update

Here’s a 60 min chart of the last 7 days, after an initial breakout of the short term VWAP notice that it stopped and found perfect resistance at the first positive deviation line of the volume average. Now it is very important to stay above the first negative deviation line at $480; any weakness below this level is a good indication that the selling pressure is increasing with the possible outcome of a new bottom below the previous one did at $440.
For now, watch out the 480$ level.

chart

Short Term Update: Now Bullish

In the previous update I mentioned as a possible resistance area the price zone from 480 to 510 dollars but the price has risen above my short term VWAP, i’ve to conclude that at least in the short term bitcoin has returned to a bullish position.
At this point I think that  XBT/USD could test the $ 540 resistance before some profit taking will take place.

The volume on all the main exchanges is high. Usually, momentum investors prefer to buy stocks that are rising with high volume, i hope they will be back to restore bitcoin price to at least 600 dollars as it was before the recent selloff.

chart

Short Term Update

I expected the support at $475 to hold instead the market has dropped further more to $ 440 or so, with this decrease the VWAP average adjusted itself to $ 509 from $520 and the first negative deviation line is now at 480 dollars.

I believe that XBT/USD will eventually end the rebound in this price zone, between 480 and 510 dollars; after that it will probably resume the drop within 24-48 hours. Any strength above $510 would suggest the intention of this market to reverse to the upside confirming ~$440 as a temporary bottom.

chart

Short Term Update: 60 min chart

chartThe recent sell off has brought the bitcoin into some decent short term support; the top chart above shows the XBT/USD coming into support that is defined by the first deviation line of VWAP, computed using only last 7 days of data for a very short term indication.
The bottom pane of the chart shows the RSI in oversold territory but its average is higher and this let me think that there should be a retest of the $500 support level.
It would appear to me that strong support in the near term comes in around the $470-$480 price zone while resistance is at the VWAP, now at ~$530.

I don’t expect to see bullishness soon but there is the possibility that if $502 will hold then bitcoin will have enough energy to recover the $550 level before dropping again.

Short Term Update: genuine crash at bitfinex or an orchestrated manipulation?

chartThis is a 5 mins chart of Bitfinex, i suspect that the decline may have been started by few speculators who knew that due to the margin call effect would have done the rest stacking and forcing many sale orders in multiple accounts provoking a quick flash crash that pushed the market enough low to allow them to rebuy at a much lower price.

Aniway the price is recovering and moving towards the fast VWAP at $535 that will act as resistance for the next few days.

UPDATE:
An interesting article about what supposedly happened at BitFinex.

Long Term Update: At Support

chartI attached here on the left a long term chart where each bar represents one day of market activity.
XBT/USD is fully in a short term corrective phase inside a long term bull market because the price recently has been above my one year vwap, now at $530.

I think that if there will not be an increase in volatility it is unlikely that we will see a drop below the VWAP, instead if a small flash crash will develop this month the support could be at about $450 (in between the VWAP and the first negative deviation line now at ~$373)

At this point if I see in the coming days the volume turning positive (it is also a sign of a recovery),  I might decide to increase my bullish position.

(Price Data used in the chart is an average of several exchanges)

Short Term Update: Forecast for this week

XBT/USD reacted from the triple bottom at ~$555 but I think that this market is now flat with a short term bearish tendency, for now buyers showed up at the first static support level. The 1 year VWAP is now at $520 and the 2 months VWAP at $508, i consider this price zone a good buying opportunity in case of a further drop below the static support ($555).

Weekly price levels computed with my method are:

Support: $559
Resistance: $600
Volatility level: 20%

For volatility level expressed in % i mean the instantaneous volatility level compared to the highest historical value (100%), why instantaneous? because it is computed using only last 20 days.