Long Term Update

chart
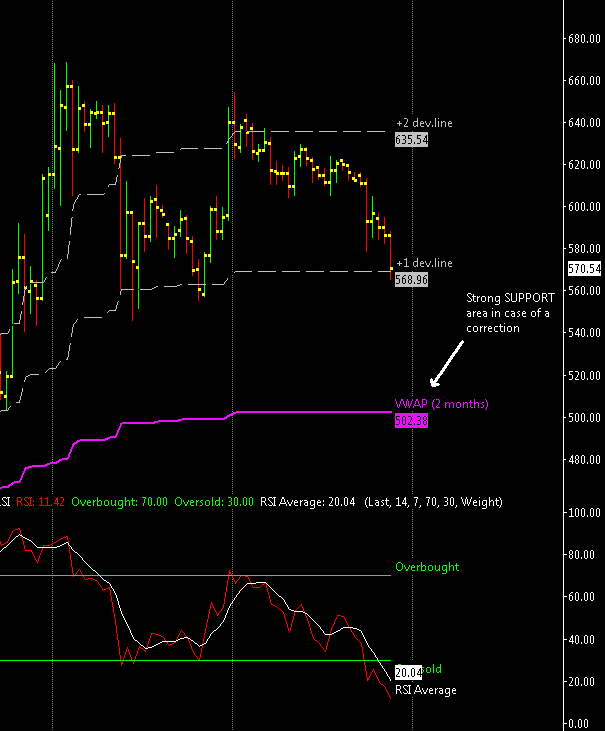
The trading range has been broken to the downside, at this point it is better to check my 2 months VWAP to see where are decent supports.
We have ~$570 and the VWAP itself at $500. At the moment the price is floating around the first positive deviation line ($570) i’m not sure if it can react from here or not despite the fact that the daily RSI is very oversold, but if during August there will be a drop down to $500 i’ll probably increase my position.

With the recent level of volatility (relatively low) a drop to $500 is possible and i think that there are many investors out there ready to buy at a cheaper price, at or below five hundreds dollars.

To conclude, we are seeing a physiological drop, totally unrelated to good/bad news; it is only an issue of supply and demand trying to find a new equilibrium point; once reached a new bottom is established and this market will be ready to move up again.

Short Term Update: again congestion

XBT/USD is again in a congestion, i’ve already spoken many times about how to measure a congestion in previous udpates but remembering the Romans saying: repetita iuvant (repeating does good) i decided to repeat again the whole concept of price congestion.

Congestion occurs when four consecutive bars open or close within the range of a “measuring bar”. A “measuring bar” becomes such when its price range contains the opens or closes of at least three of four subsequent price bars. Price movement may be broken into three distinct and definable areas:

  1. Ledges – less than 10 price bars
  2. Congestions – 11-20 price bars
  3. Trading Ranges – 21 bars or more with a breakout usually occurring before the thirtieth bar

Now 20 days are gone without a breakout above or below the “measuring bar” (i consider the measuring bar the one of last 30 June) and we are in a congestion and close to become a trading range. The reported channel upper and lower price level is very similar to our measuring bar, from $595 to $640, I expect a breakout above or below these 2 levels within the next ten days because on average a congestion phase for this market never lasted more then thirty days.
I’d be very surprised to see the price still inside this trading range in August, IMO the odds are for a breakout above $640 considering the underlying trend which is pushing up.

chart

Short Term Update

chartXBT/USD is slowly retracing back in the lower part of the price channel. This price channel is computed using a fitting function that highly smooth the data and the deviation lines are computed using the average true range, overall it is a bit different from the other approach used by me: VWAP and its deviation lines.
The color of the midpoint channel line represents the slope, white it means the tendency is flat, red and green for a bearish or bullish tendency.

I think that this market is now flat with a short term bearish tendency that should end with a new low at or above $575, any weakness below it and especially below the recent bottom at ~$550 would be bearish IMO.