Quick Update: Daily Chart

chart
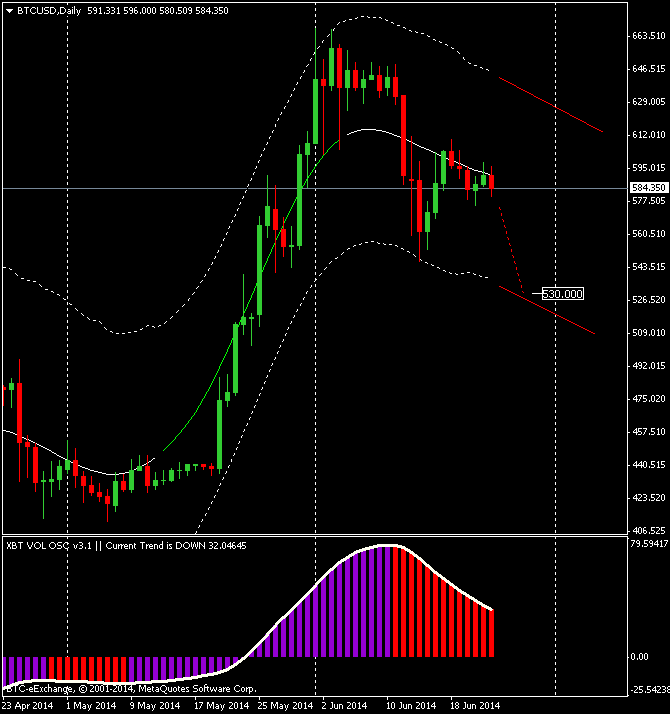
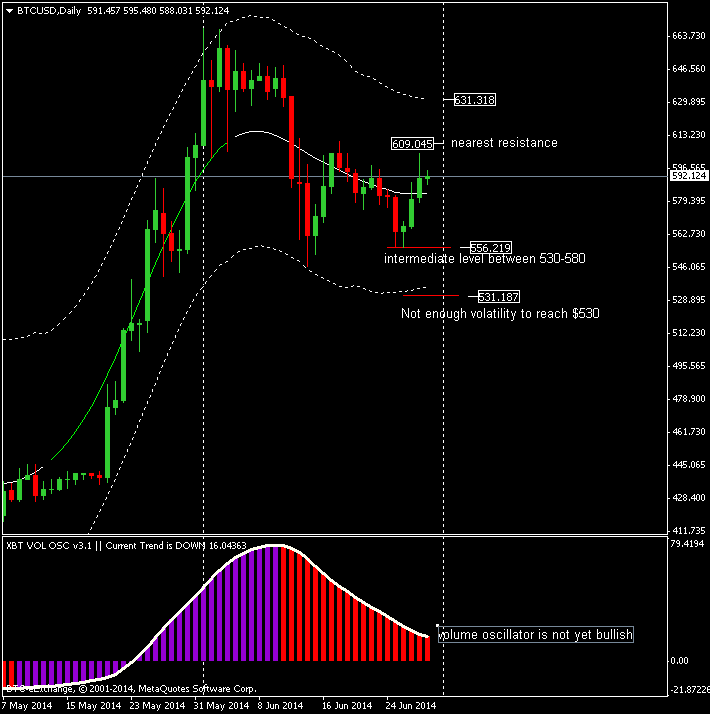
There was not enough volatility to reach $ 530, XBT / USD stopped at $555, the middle level between 530 and 580 dollars (the midpoint of the price channel).

I believe that bitcoins will remain within these extremes of the price channel between 530 and 630 dollars with the nearest resistance located at about 610 dollars. The oscillator volumes is still negative and could become positive with a strong break of $ 630.

Long Term Update: Daily Chart

chartI think that this market is still in a phase of moderate correction, not severe at all. Support for this week is at $ 575, in case of break of that support this market could reach the bottom of the price channel that I have shown in the attached graph, at around $ 530 which is the price level of strong support that I indicated in my last tweet.

I include with this chart (btce prices using metatrader 4) a proprietary volume oscillator that i developed and it is very powerful in spotting trend reversal, at the moment it is bearish.

I say again that it is important to stay above $520 for the long term, any weakness below that price level would have bearish implications for the long term although I can accept a quick spike below that price level but  it must be temporary and not for a prolonged period of time.

Short Term Update: H2 chart

chartIn my last update I had suggested a decline in prices in the $520-$580 price zone and it duly happened:) why? Well sometimes i forget that this market is very sensible to news with a strong tendency to overreact.  It is enough a modest bearish news that the majority of the trading community lose control to their emotions and cannot make up their own minds, feel free to call it the sheep effect:)

As you can see in the attached two hours chart now XBT/USD is bearish in the short term with the weekly VWAP acting as resistance at about $600.
The target for the next week is to move again above VWAP to regain a bullish position, while an immediate further correction below $520 would be bad IMO with some bearish implication also for the long term trend.

To conclude, i expect a rebounce up to $600 for the next 72 hours.

Long Term Update: Daily chart

chartThe long-term outlook of XBT/USD is still positive and a move to $750 appears likely. However bitcoin entered again in a congestion phase, a short-term correction might develop from here with a drop to the support zone at $517-$592 price range.
I remain confident that a short term bottom should develop above $580.

RSI oscillator is giving a sell signal but it is not accompanied by high volume so i’ve decided to ignore it for the moment. The net volume is positive on the 3 day chart (not included here) and not yet indicating a strong sell activity.

Strong support for the mid-long term is the 2 months VWAP at $517 @bitfinex and $508 @bitstamp.

Quick Update: 2 hours chart

chartOver the past three weeks the market rallied and almost all of the indicators I follow rallied with it but it is not enough for me, i want to see XBT/USD going above the previous top of $710 and so far the last top has been done at $680.  A 10% correction happened but the short term VWAP (computed using last 7 days) is providing support, in case of a break i see the $550-$580 price zone as a strong one which should prevent any attempts from sellers to move this market further down.

Bitcoin should move up further from here considering that the RSI oscillator is now oversold and because the price is still above the VWAP i think that an healthy correction just ended, XBT/USD should go up towards its first important test: to break through the $710 february’s price top.