
 The market reacted from the recent low of $ 340 , because of this I think it is better to look more closely at the VWAP calculated with two months of data instead of a year, why? Well because long term VWAP is no longer functioning as a support , for this reason we will put it aside for a while.
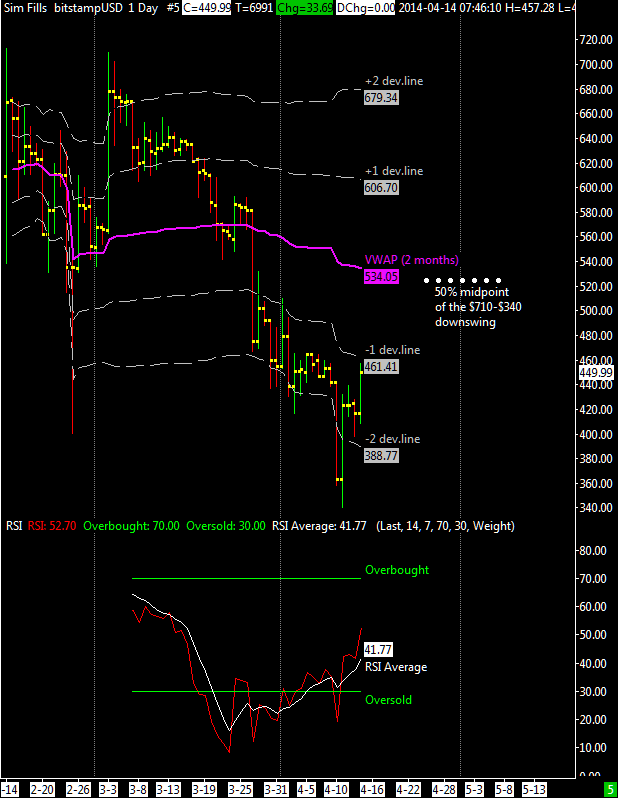
After a prolonged decline , from 710 to 340 dollars, where the market has lost almost 50% , I believe that a rebound in prices is due and it should reach the mid-point of this bearish swing up to about $ 525 .
It is not a coincidence that at $ 535 there is the average VWAP now calculated with two months of data, consequently i think that up to $ 530 would be a normal rebound in a bearish market phase.
The RSI oscillator is recovering and when the market will reach the $ 530 price level probably the oscillator will be in the overbought zone , this could lead the market to stay lateral around the resistance to subsequently resume to fall.
In any case the volume has the highest priority above these analyses based on the VWAP and its price levels , as well as the RSI oscillator; if you begin to see a positive ratio between volumes made on uptick and downtick then it will probably be the confirmation that a new uptrend has started, regardless of what price levels and oscillators tell us if buyers come back it is imperative to follow them.
To conclude, if i finally see a positive volume ratio (computed as usual on the 3 days chart) and a market moving above $530 i’ll open a long term trade, initially with half position and then moving to full position once i see on the 3 days chart my ALMA moving average turning positive. The stoploss will be tight because the final confirmation of a long term reversal there will be once the market will move above last top, located at $710.
