Long term update: Bitcoin bottom is in

chartI attached here on the left a long term chart where each bar represents three days of market activity, as i said in the past this particular time frame is a good compromise between a weekly chart and a daily chart.
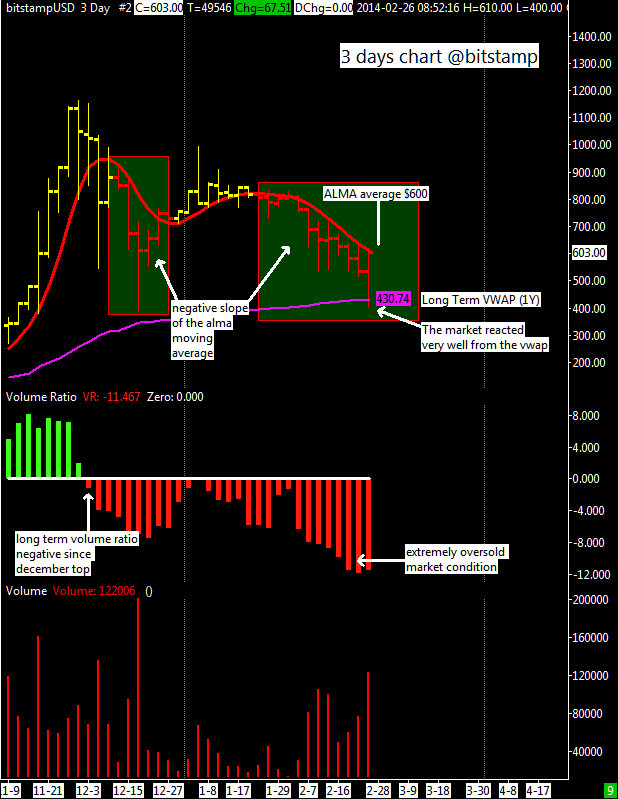
Despite the recent strong rebounce from my long term support around $420, the ALMA moving average is still pointing down confirming that XBT/USD is in a short term corrective phase inside a long term bull market because the price during last months has been always above my long term vwap, now at $430 and also above the 200 days moving average now at ~$470 and rising.

About volume activity the “volume ratio” indicator tell us that the situation is still very oversold and all the recent bearish news and the excess of pessimism among many investors let me think that probably the bottom is in but to avoid any risk before opening a long position is wise to wait a positive volume activity that should be back once a new uptrend is established and confirmed by the reversal to the upside of the ALMA moving average i use.

To conclude XBT/USD remains in a corrective phase inside a long term bull market, the rebounce should stop near $600 where there is the ALMA moving average to act as resistance level. Any strength above $600 could mean that the short term bearish trend is over and that this market is headed up again.

Short Term Quick Update

chartThe recent sell off has brought the bitcoin into some notable short term support that I believe deserves attention. The top chart above shows the BTC/USD coming into support that is defined by the second deviation line of VWAP, computed using only last 7 days of data for a very short term indication.
The bottom pane of the chart shows the RSI in oversold territory but its average is higher because of the 5k bitcoins dump just happened at bitstamp.
It would appear to me that strong support in the near term, comes in around the $500-$520 price zone while resistance is above the VWAP, now at $590.

I don’t expect to see bullishness soon, i’m still looking for a long term bottom around $420.

Long Term Update: 3 days chart at Bitstamp

chartBTC/USD is trading beneath its 50 day moving average today as I write this, that average is now at $780. Coupled with the high volume on the downside, especially in the last 10 days,  this is solid evidence for a reversal of the short term market trend from up to down.

I think that BTC/USD will drop 200 dollars from here down to the long term support, my long term VWAP calculated using last one year of data.

If I am right about this the prognosis calls the bottom should develop as a conseguence of the MtGox drama, that exchange (if we can call it an exchange…) is almost out of business, my guess is that it is down of bitcoins and with strong manipulations of the price they are trying to recover the money lost due to the malleability issue from their own customers, this practice is of course totally illegal in a regulated market, i don’t want to go in the details but looking MtGox price and volume data there is a strong evidence of such activity.

Back to our long term chart, is this the start of a bear market? I think it is too early to tell. The 200 day moving average is around my long term VWAP  so a drop under it would be the first clue that a bear market has begun. Also the other kind of average i use, the ALMA moving average, turned negative during the prolonged trading range of January.

I added a new indicator, similar to my “net volume” indicator, the only difference is that it computes the ratio between buyers and sellers and it has been remarkably accurate staying in bearish territory since November top; it looks good as a trend following tool.

For the short term i think the price is now in a congestion in the $520-$720 price zone, a strong bottom where to shake out all weak hands is necessary and very healthy in my view and  if  this event will be accompanied by MtGox going out of business indefinitely, then the bitcoin market will be ready to move up again.

Long Term Update

As i thought the trading range has been broken after 30 days, it’s very unlikely to see more then that for a market congestion and with no exception this market respected this common rule. For the majority of the time prolonged trading ranges resolve with a strong break to the downside once the smaller trading ranges are broken.

chart

I’ve now two support levels, 640 and 515 dollars for the short term and i think that in this price zone some buyers will show up. For the long term supports are on my long term VWAP ($400) and the 200 days moving average now at $420.
Many are arguing that we are falling because of MtGox, i don’t agree with this view, it’s just an excuse to sell we all know that MtGox is out of business since months. When the market is in low sentiment regime good news are ignored and overreactions to bad news from investors are common.

Short Term Update: Bitcoin blocked in a trading range

chartThe BTC/USD at bitstamp exchange has been trying to bottom, but has been blocked in a trading range since 7 January ’14. There have been several attempts to move above the short term VWAP without success, every time my average halted the price advance; this means we have an accurate dynamic level that help us to understand when to enter this market: at the breakout of that level (now located at $828).

I think that if the weakness will continue in the coming days, we could see a low near $ 785, where there is the first negative deviation  line. RSI average is close to oversold, indicating that a bottom is near.